eNPS monitor
By 2DAYSMOODIES | 16/02/2024
Welcome to our eNPS monitor! In this section, we share 2DAYS-DATA insights about the eNPS. eNPS stands for 'Employee Net Promoter Score,' which is a measure of employee satisfaction and engagement with the organization. The eNPS is assessed through the following question: 'On a scale of 0 to 10, how likely are you to recommend [company/organization] as an employer to friends or colleagues?'
Measure your team or organization at the eNPS level (with 2DAYSMOOD)!
Utilize our eNPS monitor as a benchmark!
Here are guidelines for interpreting the data.
Employees respond to this question with a score ranging from 1 to 10, resulting in three groups: Detractors, Passives, and Promoters.
- Detractors (scores 1 to 6): These are the employees who give a low score, indicating dissatisfaction or criticism of certain aspects of the subject. They may not be very positive about their experience.
- Passives (scores 7 and 8): These are employees who are reasonably satisfied but not extremely enthusiastic. They are not dissatisfied, but they are also not actively recommending the subject to others.
- Promoters (scores 9 and 10): These are the most satisfied employees. They have had a very positive experience and are likely to actively recommend the subject or service to others. They are considered "promoters" of the company or service.
We use the international eNPS within this section, and the above groupings are based on it. If you would like information on European eNPS data, please contact us!
Quickly access the eNPS monitor of your choice
A deeper look into employee satisfaction and engagement across different sectors.
In the complex world of industries, where each sector has its own challenges and highlights, the Employee Net Promoter Score (eNPS) provides fascinating insights into employee satisfaction and engagement. Below, we delve into the 2DAYSDATA and discover how different sectors compare to each other.
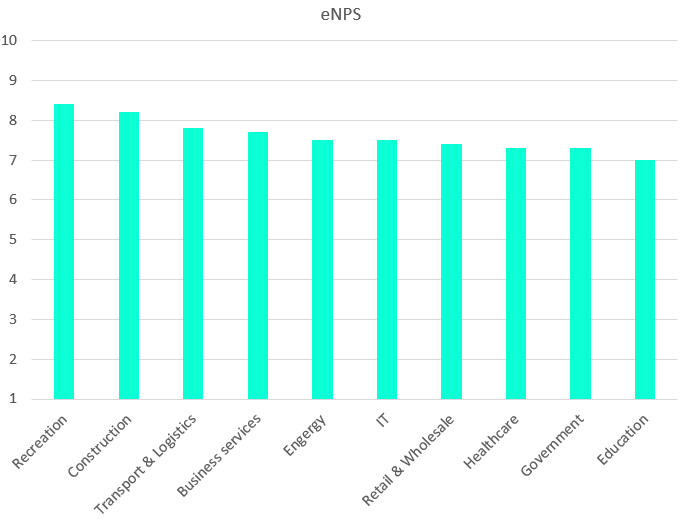
Average eNPS
The average score for all industries on the eNPS question falls between 7 and 8.5, with an overall average of 7.75. This raises the question: how do eNPS scores vary within specific sectors, and how do the eNPS groups (Detractors, Passives, Promoters) influence the differences?
Recreation
The recreation sector thrives with the highest average score of 8.4. What stands out is the exceptionally large group of promoters, constituting 55% of the workforce, 25% more than the average across all sectors. This sector seems to thrive on a culture of employee satisfaction and loyalty, which other sectors may consider as inspiration.
Construction
Following the recreation sector, construction performs exceptionally well in terms of employee satisfaction and engagement. In this sector, employees give their organization an average of 8.2 on the eNPS question. The construction sector stands out with only 6% Detractors, the smallest Detractor group among all sectors. There is also an impressive group of 41% Promoters, indicating a sector where employees are predominantly positive and less prone to criticism.
Transportation & Logistics
The Transportation & Logistics sector averages a 7.8 on the eNPS question, nearly identical to the overall sector average. This sector shows some minor deviations from the average within the groups, but overall, the percentages of Detractors, Passives, and Promoters are comparable to the overall average.
Business services
This sector, including finance and insurance, averages a 7.7 on the eNPS question. This score is almost identical to the average. When looking at the distributions among the three eNPS groups, they are also nearly identical to the average.
IT
The IT sector averages a 7.5 on the eNPS question, slightly below average. In the IT sector, we see that the Detractor group comprises 20% of all employees. This is 5% more than the average. This might encourage organizations in this industry to delve deeper into the causes of this criticism and strive for proactive solutions.
Energy
The scores in this sector are very similar to those in the IT sector. The energy sector also averages a 7.5 on the eNPS question. The Detractor group is 21%, which is 6% larger than the overall average.
Retail & Wholesale
This sector averages a 7.4 on the eNPS question, slightly below the overall average. In the Retail sector, we see a rise of 9% in the Detractor group compared to the average, making 24% Detractors within this sector.
Healthcare
Despite being a pillar of our society, the healthcare sector faces an abundance of Passives, namely 65% of the workforce. This is 10% higher than the average. The average score that healthcare workers give to their organization on the eNPS question is 7.3, below average. A deeper focus on engagement strategies seems crucial here to increase satisfaction.
Education
Education is at the bottom of the spectrum with an average score of 7 on the eNPS question. A deeper data analysis reveals a very large group of Detractors, namely 28%. This is almost double the average across all industries. It raises questions about the challenges this sector faces, emphasizing the need for significant changes to increase employee engagement.
The eNPS question not only provides a score but opens the door to a profound understanding of employee satisfaction and engagement across various industries. It offers organizations benchmarks and insights to increase employee satisfaction and create an environment where every sector can thrive. It is a powerful tool for companies aiming for more workplace happiness and a healthy workforce.
Curious about the eNPS within your team?
Discover it now with a free and non-binding quick scan.
Are we ambassadors for our employer?
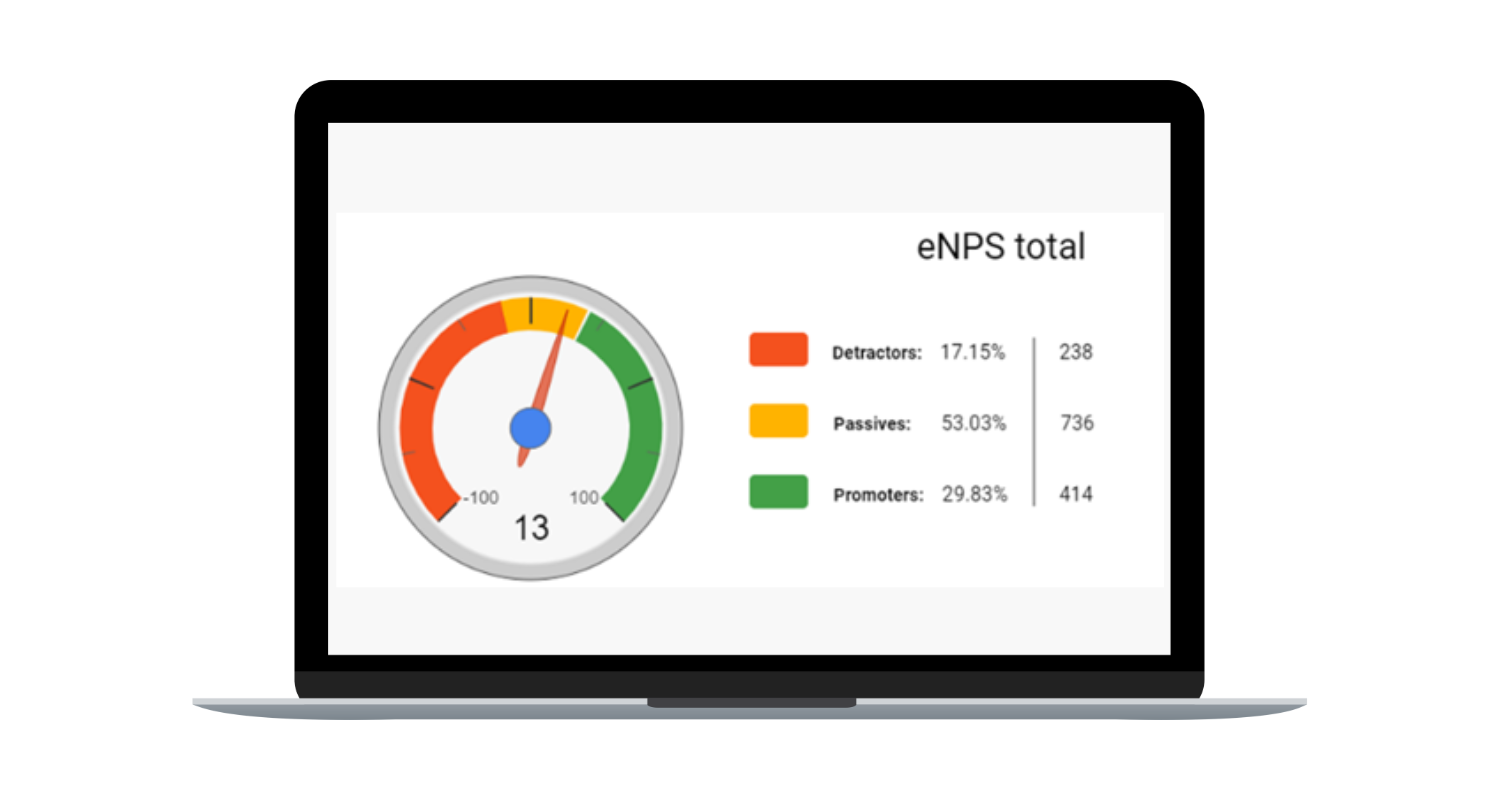
Looking at the figures for the month of June, we can see that we gave our employers an eNPS score of +13 with an average 'grade' (on a scale of 10) of 7.68. Furthermore, the distribution is as follows: 30% Promoters, 53% Passives, and 17% Detractors.
In other words, in June, 83% of employees respond positively to the question 'How likely are you to recommend [organization] as a good employer to others?' and 30% are active Promoters.
How does the eNPS development look this year?
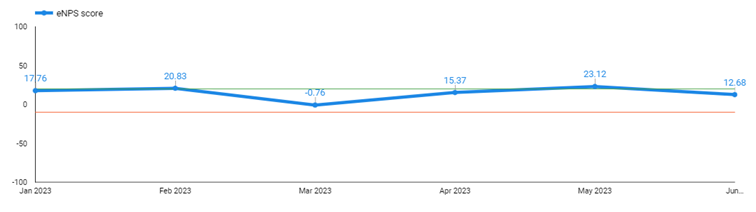
Looking at the above graphs, we see that in the current year in the Netherlands, on average, more people are Promoters of their company than Detractors. The figures show that 85% of working Netherlands is positive about their employer. (And 29% of employees are so positive that they give their employer a grade of 9 or 10!)
Is that good? Or can it be better? Let's say it's moderately positive, but there is room for improvement!
Looking at the year, we see that in June, we are below the average, so advice to all our bosses: a little extra effort... It's appreciated!
Do you want to monitor the eNPS within your own team?
Request a free quick scan here.

Get in touch for free advice, a demo or quick scan!
Always the employee survey that suits you.
Do you want to increase happiness in your teams? Collect feedback on a specific subject? Monitor stress in real-time? Or do you need a baseline survey to get insight in the drivers of your culture?
We are happy to help with your specific challenge, using:
- Our expertise, experience and energy!
- A demo of our tool (if you like)
- The opportunity to try it for free
- Or enjoy reading our brochure
