![]()
Analyze data flawlessly for the best decisions
Track trends on our dashboards, use our recommendations and compare with other industries or predict the impact on your key KPIs.

Happy employees are crucial to the success of any business, driven by their emotional well-being
They blossom into more dedicated, more productive employees with deep-seated loyalty. But what is the secret to continually nurturing this state of satisfaction? The key lies in gaining a deep understanding of what drives them and the various elements that influence their emotional well-being.

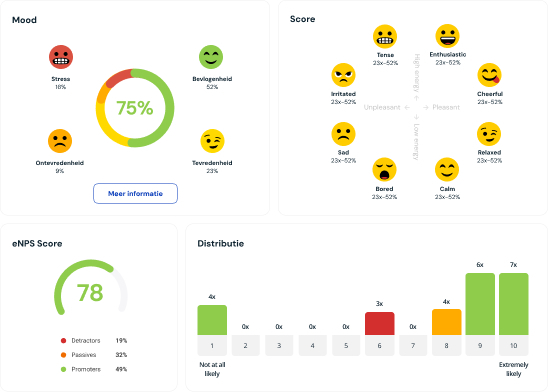
Translate data into insights, but without required knowledge of data analysis
Graphs and trends in the dashboards easily show the current situation and help with interpretation. Working almost without thinking, yet data-driven.

![]()
Connect employee happiness data to your key performance indicators
Don't focus exclusively on absence and turnover figures outside our platform. Instead, link these to our data on workplace happiness to provide insight into the investment and impact of your actions.
![]()
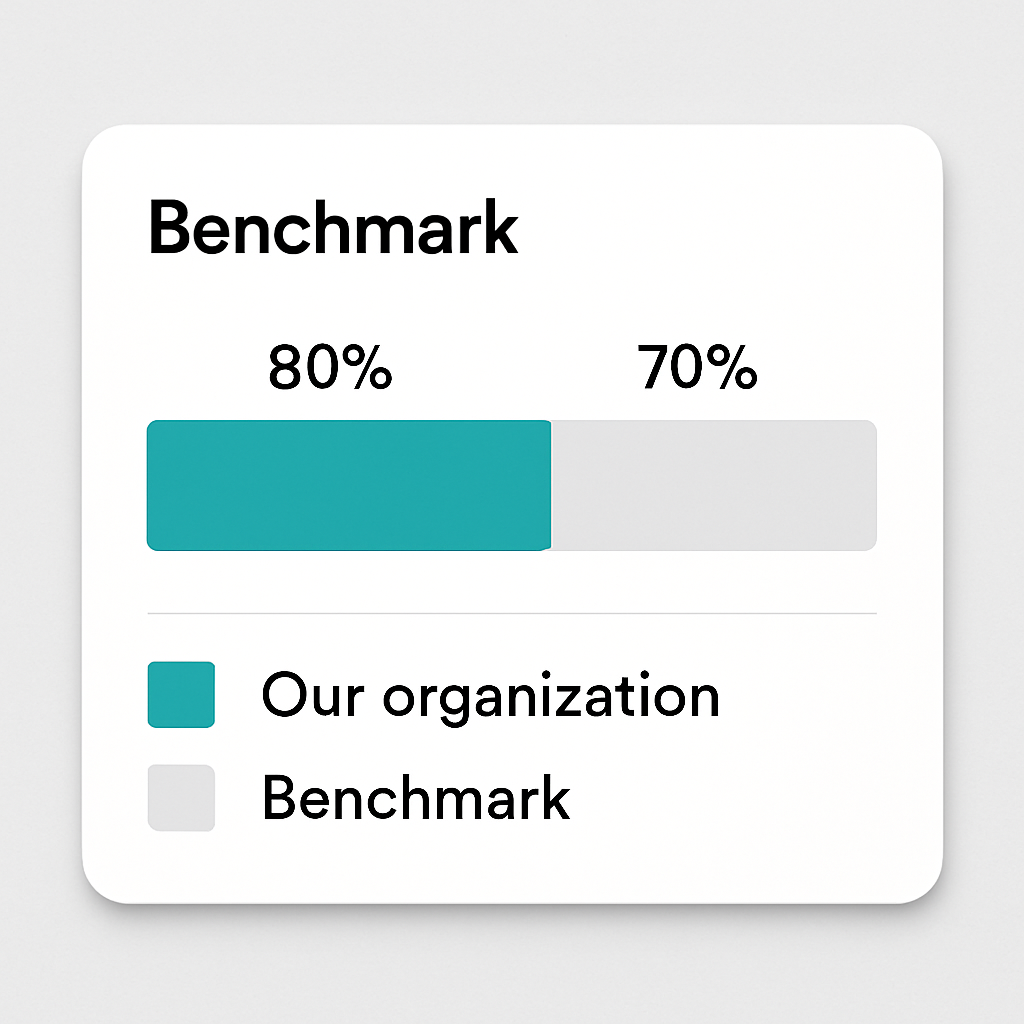
Benchmark results with our data
Within the platform, you can directly compare results with a relevant industry.