Happiness at work research: figures and trends every month
By 2DAYSMOODIES | 03/04/2024
Welcome to this monthly blog about happiness at work research in the Netherlands (and soon about happiness at work in the world!) We are 2DAYSMOOD, a driver of employee happiness and winning organizational cultures, and an expert in the ESS 3.0: the employee satisfaction survey, but faster, simpler and always relevant insights!
Every week we collect data on excitement, (dis)satisfaction and stress of employees and managers, in various organizations from 20 different sectors, via more than 4000 surveys. Participating organizations can view their own data in real time. We bundle the anonymous data every month and paint a representative trend picture of the workers' mood. We also delve deeper into a specific theme, such as one of the drivers of engagement and happiness.
Does your team or organization also measure the level of stress and excitement (with 2DAYSMOOD)? Or is there an employee satisfaction survey being done in relation to working from home?
Then use our charts as a benchmark!
Here are some guidelines
- Excitement, among other moods, is measured through 8 validated emotions, divided over the axes energy and pleasure. Emotions that are both pleasant and energetic (cheerful or enthusiastic) belong to excitement. A source of innovation and creativity.
- When energy decreases but the pleasant mood remains, you get satisfaction. This often leads to stability and productivity in work and behavior.
- With these insights we create the formula: excitement + satisfaction = happiness at work = more successful organization.
- A good objective for a profitable level of happiness at work is that moods should ideally be 75% positive and 25% negative. Teams function best in that 3: 1 balance!
- This is threatened if stress (frustrated or tense) and / or dissatisfaction (tired or sad) occur for a long time. So pay attention to the development of trends! In the worst case, this will lead to employees dropping out or leaving the company.
- A short stress period, after which enough recovery can occur, is not bad and even helpful with deadlines. Think of an average stress level of max. 20%.
- Hopefully these guidelines provide insight, but ultimately it's important that you create your own internal benchmark and make positive change from there.
- We can help with this with a free quick scan!
Shortcut happiness at work research per month
2024
- March 2024 happiness at work research
- February 2024 happiness at work research
- January 2024 happiness at work research
2023
- December 2023 happiness at work research
- November 2023 happiness at work research
- October 2023 happiness at work research
- September 2023 happiness at work research
- August 2023 happiness at work research
- July 2023 happiness at work research
- June 2023 happiness at work research
- May 2023 happiness at work research
- April 2023 happiness at work research
- March 2023 happiness at work research
- February 2023 happiness at work research
- January 2023 happiness at work research
2022
- December 2022 happiness at work research
- November 2022 happiness at work research
- October 2022 happiness at work research
- September 2022 happiness at work research
- August 2022 happiness at work research
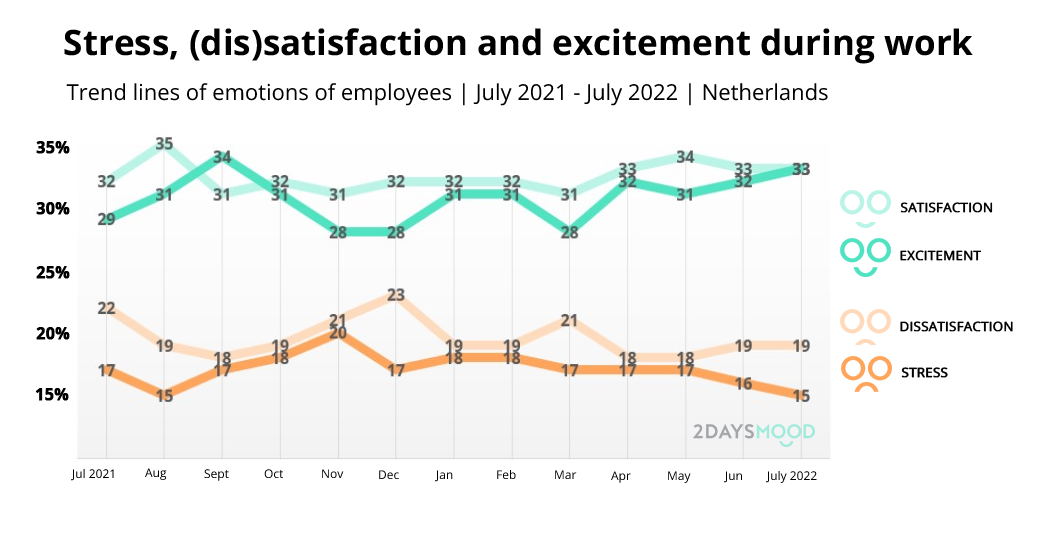
- July 2022 happiness at work research
- June 2022 happiness at work research
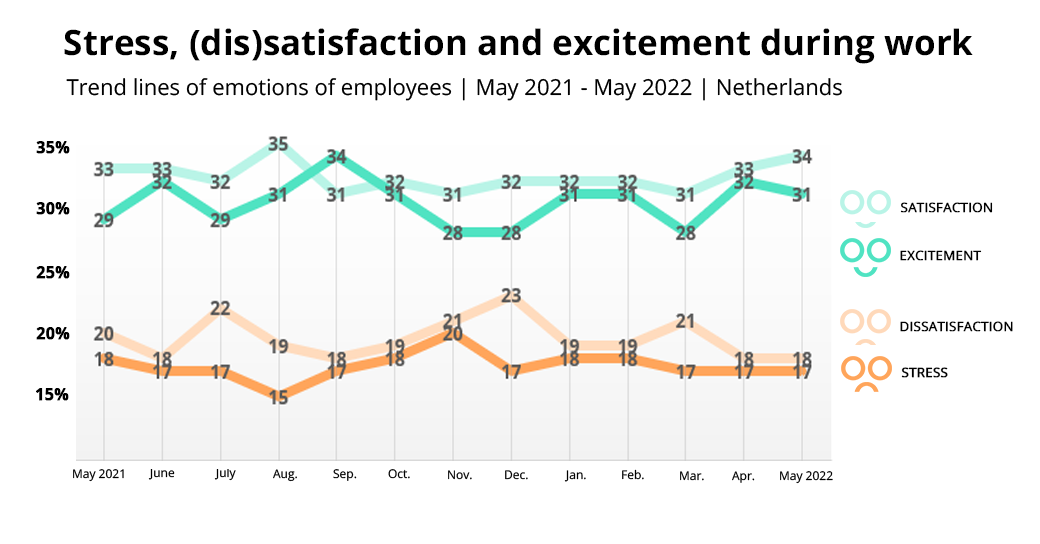
- May 2022 happiness at work research
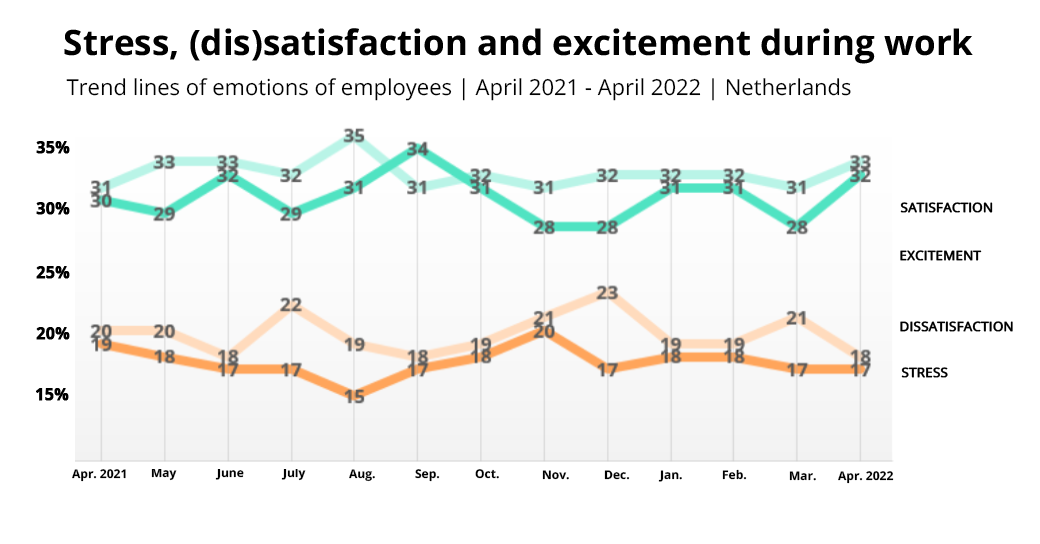
- April 2022 happiness at work research
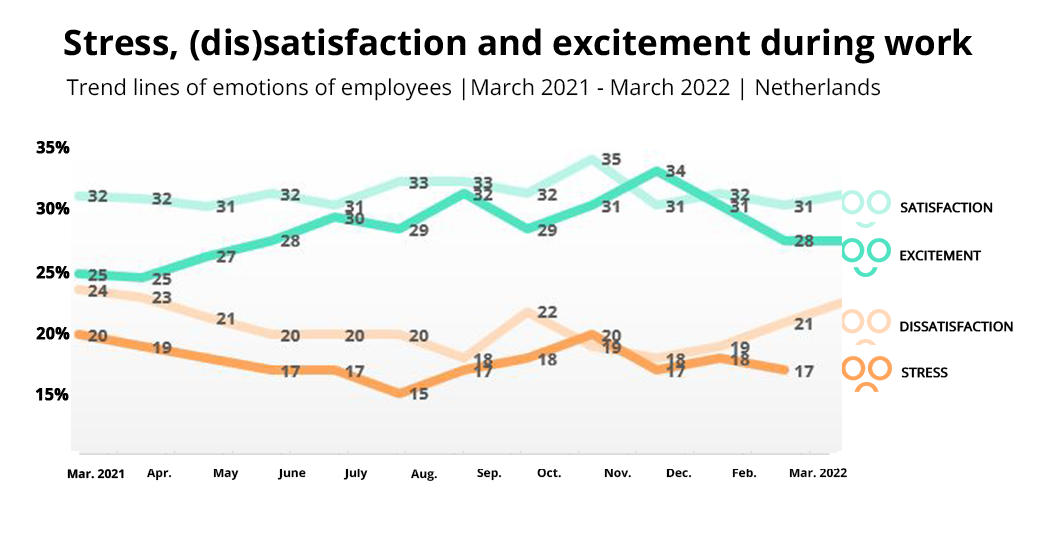
- March 2022 happiness at work research
- February 2022 happiness at work research
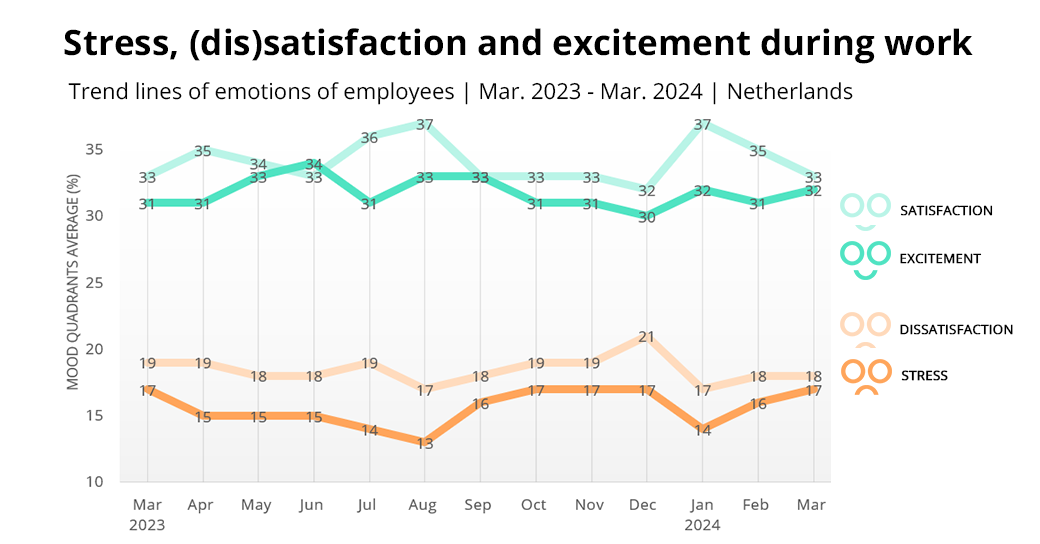
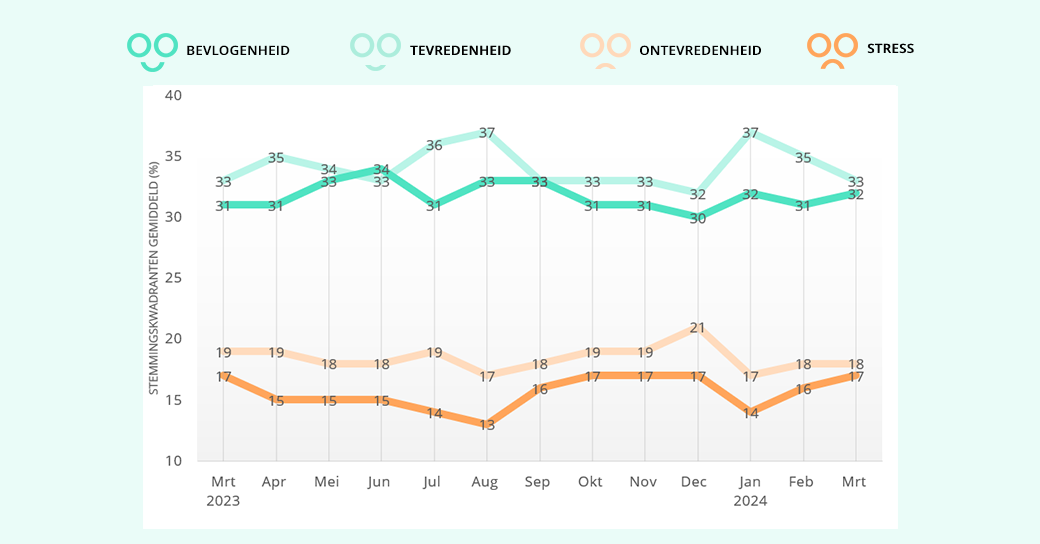
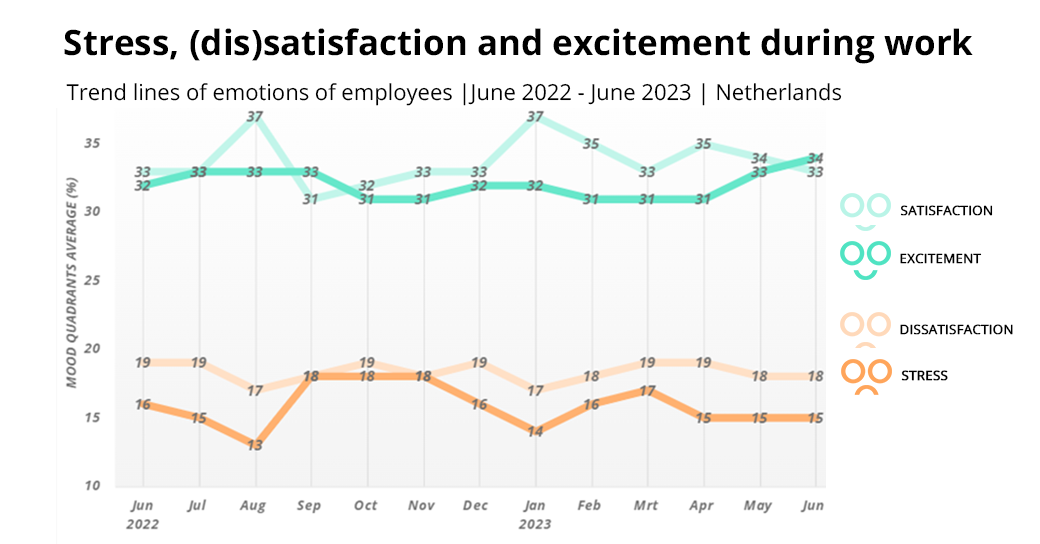
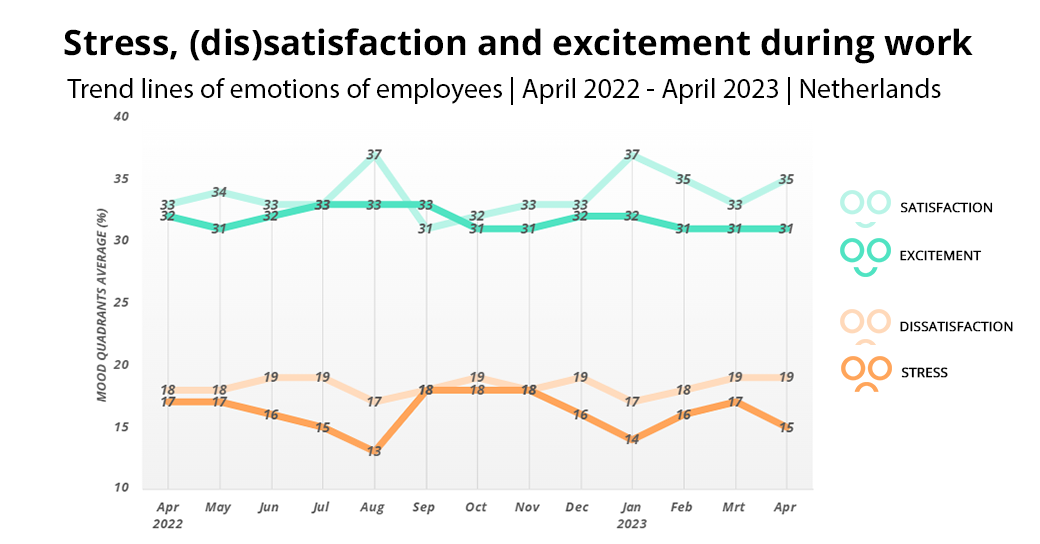
With the monthly 2DAYSMOOD engagement monitor, we delve deeper into how employees felt during the month of March.
Mood in March
Our data shows that 35 percent of employees were in a negative mood in March. This means that 65 percent of them felt happy at work during this month. This ratio has remained almost the same compared to February when 66% of employees experienced a positive mood. However, unfortunately, we see a slight decrease in positive mood during March.
A deeper analysis of this trend shows that employees who were in a positive mood in March were, on average, 32 percent engaged. This is a slight increase of 1 percent compared to February. Additionally, 33 percent of employees experienced a feeling of satisfaction, a decrease of 2 percent compared to the previous month.
Within the negative moods, we see that employees in March were, on average, 18 percent dissatisfied, the same as in February. Furthermore, 17 percent of employees felt stressed, an increase of 1 percent compared to February.
Overall, we can conclude that employees scored slightly higher in the level of energy in March compared to February, both in positive and negative moods. Stress and engagement are perceived as high-energy states, while satisfaction and dissatisfaction are lower in energy. With the days getting longer, perhaps employees are experiencing more energy as a result? We look forward to further developments in mood as the days lengthen!
Reasons for the mood
In addition to their mood, employees in our 2DAYSMOOD tool indicate the reasons behind their mood. What we often see as a reason for a negative mood at work, and also this month, are personal and private circumstances. These can range from health issues to family challenges, financial stress, or other personal issues that can lead to fatigue, pressure, and stress at work. This negatively affects the well-being and performance of your employees. Thus, our data emphasizes the importance of providing support to employees with their personal challenges to promote a healthy and productive work environment. But how can you, as an employer, best address this?
Take action
Supporting your employees with their private challenges leads to a more positive and productive workforce. See below how to approach this:
- Flexible working hours: offer flexibility to employees by, for example, providing flexible working hours or adjusting work hours to accommodate personal obligations such as doctor appointments, childcare, or family needs.
- Leave policies: ensure a generous leave policy that allows employees to take leave for personal circumstances, such as illness, family matters, or personal emergencies.
- Counseling and support programs: provide access to counseling services or other support programs, such as an employee assistance program, that can help employees cope with personal problems, stress, or emotional challenges.
- Supportive communication: communicate openly and empathetically with employees about the available support and resources for personal circumstances. Encourage employees to voice their needs and offer a listening ear for any concerns or issues. Read more.
- Promoting work-life balance: encourage a healthy work-life balance by promoting boundaries between work and personal time, encouraging vacation use, and reducing overtime. Read more.
- Training and education: offer training and educational programs for managers and supervisors on recognizing signs of stress, providing support to employees, and promoting a positive and supportive work environment.
Do you want to monitor and improve a positive work culture within your team? Request a free quick scan here.
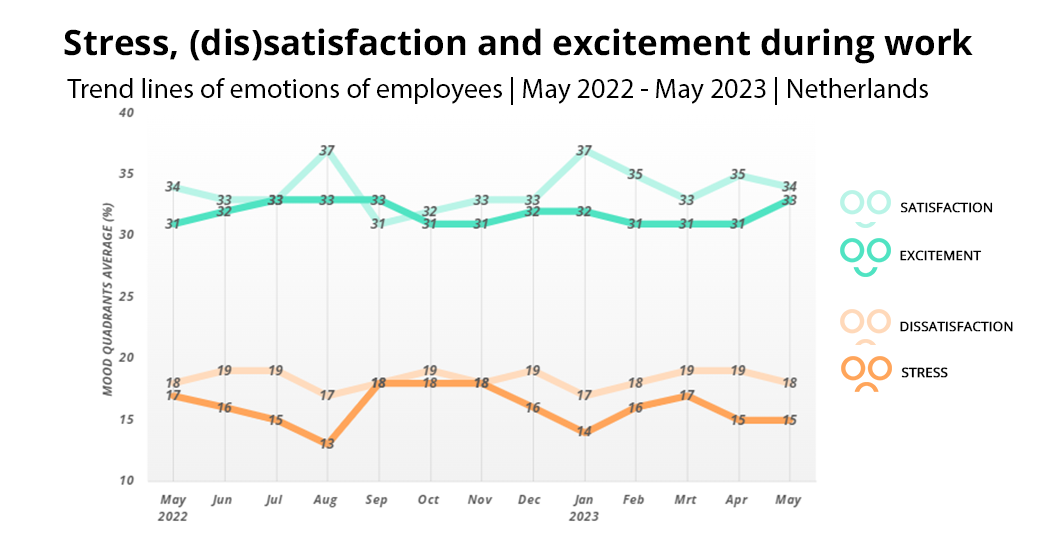
It's time for the 2DAYSMOOD Engagement Monitor again! We delve into how employees felt throughout the month of February.
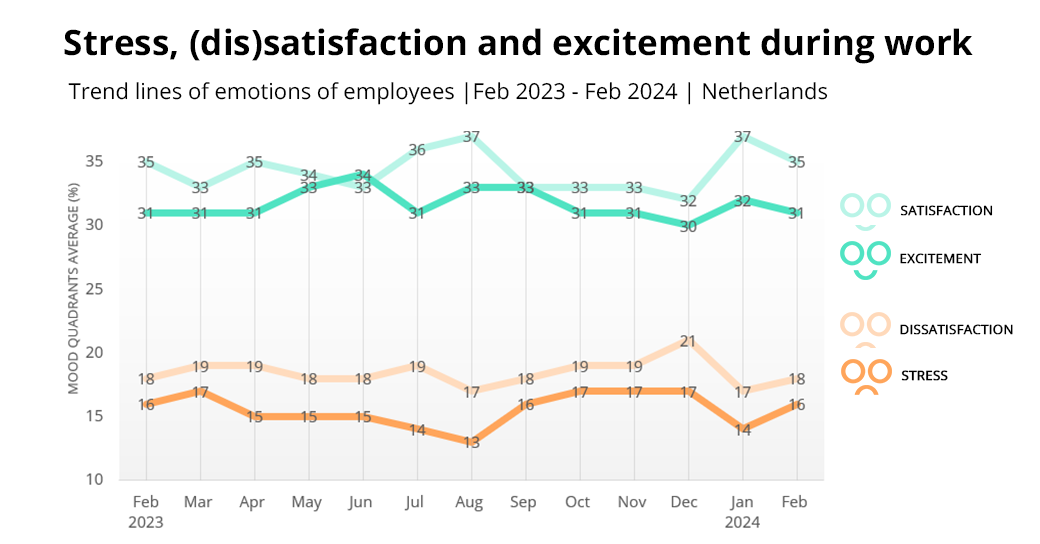
Mood in February
February has arrived, and we observe a slight shift towards a less cheerful mood in the workplace compared to January. In our data, we see that 34 percent of employees were in a negative mood. This means that 66 percent of them felt happy at work in February. Last month, 69 percent radiated positivity, so unfortunately, we're experiencing a small dip this month.
Digging deeper into this trend, we find that employees within those positive moods were on average 31 percent engaged. This is a slight dip of 1 percent compared to the previous month. Additionally, 35 percent of employees experienced a sense of satisfaction, a subtle decrease of 2 percent compared to last month.
Within the negative moods, employees were on average 18 percent dissatisfied, a slight increase of 1 percent from January. Furthermore, 16 percent of employees felt stressed, an increase of 2 percent compared to the previous month. Interestingly, all moods in February 2023 were exactly the same as those of last February.
The optimal balance of moods is 75 percent positive and 25 percent negative. This is based on the notion that for every negative emotion, there should be three positive emotions. So, there was a slight setback last month. The current figures are drifting further away from this ideal balance. This is not good news for working in the Netherlands, especially for employers. It's time to turn the moods back in the right direction! But how? Read on.
Reasons for the mood
In addition to their mood, employees in our 2DAYSMOOD software tool indicate the reasons behind their mood. The standout word this month when looking at the reasons behind positive emotions is "Colleagues." The Relationship with colleagues is one of the drivers of workplace happiness in the Employee Happiness Model.
If we want to enhance positive moods among employees, it may be beneficial to focus on this aspect. Below are some useful tips for employers on how to do this!
Take action
Promoting a positive work environment and strengthening relationships and collaboration among colleagues are essential for successful teams and, consequently, successful organizations. Therefore, we provide you with tips and tricks below to increase team spirit:
- Team building activities: regularly organize team-building activities outside the workplace. This can range from informal lunches to more structured team-building days.
- Open communication: foster an open communication culture where employees feel free to share ideas, feedback, and concerns. This can be encouraged through regular meetings, both formal and informal.
- Shared goals: ensure that all team members understand how their individual contributions fit into broader business goals. This creates a sense of shared responsibility.
- Express appreciation: acknowledge and reward employees' efforts. Examples include giving compliments, designating an 'Employee of the Month,' etc. Check out our whitepaper on appreciation for all the ins and outs on this topic!
- Informal social time: create space for informal interactions among colleagues. This can occur during coffee breaks, lunches, or social events after work.
- Diversity and inclusion: foster an inclusive work environment where diversity is valued. This contributes to a richer team dynamic and promotes understanding among colleagues.
Do you want to monitor the workplace happiness and engagement within your own team? Request a free quick scan here.
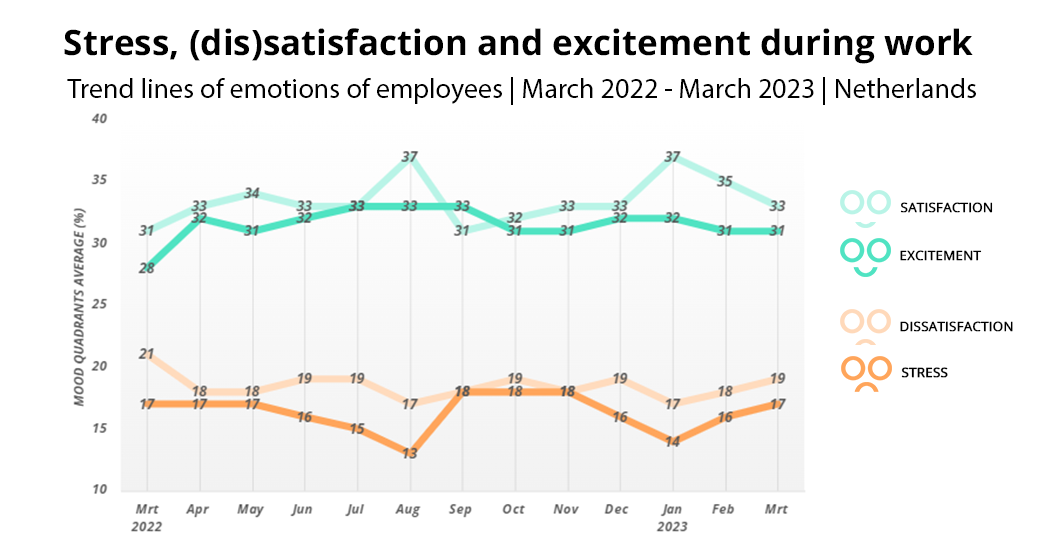
It's time again for the 2DAYSMOOD engagement monitor! We delve into how employees felt throughout the month of January.
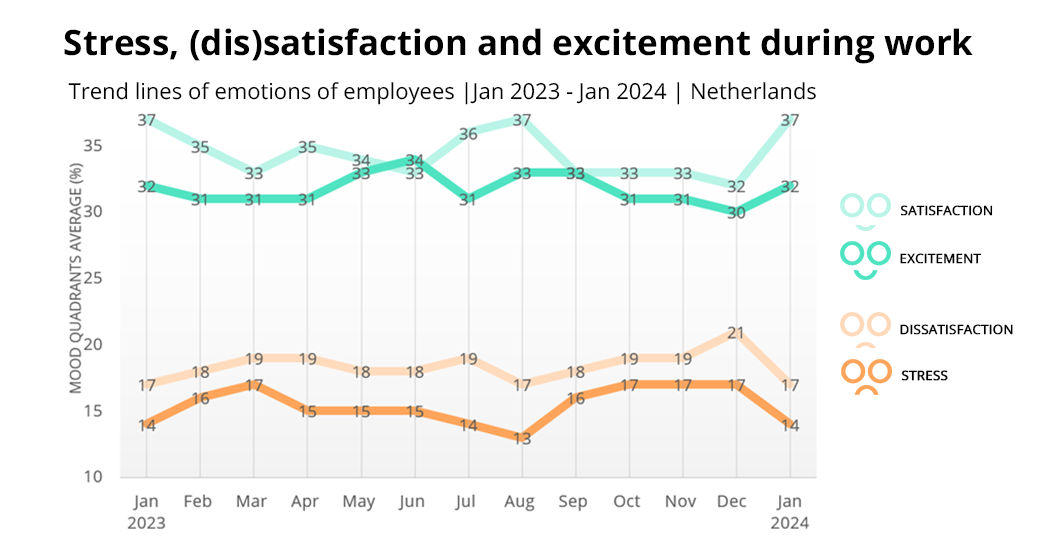
Mood in January
In the month of January, we observe a clear shift towards more positive moods among employees. In our data, we see that employees experienced 69 percent positive moods. This means that 31 percent of negative moods were experienced in January among employees. Last month, only 62 percent positive moods were experienced, so we see a significant positive shift in January!
Digging deeper into this positive trend, we see that within the positive moods, employees were on average 32 percent excited. This is an increase of 2 percent compared to the previous month. Employees were also 37 percent satisfied. Particularly, this is an increase from the previous month, namely a 5 percent rise.
Within the negative moods, employees were on average 17 percent dissatisfied, a decrease of 4 percent compared to December. Furthermore, employees were on average 14 percent stressed, a decrease of 3 percent compared to December. Both negative moods are therefore experienced less by employees in the new year.
When comparing the mood data of January 2023 with the data from last January, we see that all mood percentages are exactly the same.
The mood balance should ideally be 75% positive and 25% negative. So, there has been a very positive movement in the right direction compared to last month. The current figures are very close to the ideal balance; this is a good start to the new year. If dissatisfaction is slightly reduced within organizations, a perfect mood balance could be achieved. This could be a good goal for employers. But how can this best be done? We delve into that in the next chapter!
Reasons for the Mood
In addition to their mood, employees in our 2DAYSMOOD software tool indicate the reasons behind their mood. This month, we see a very positive mood trend. When delving into the reasons behind the positive moods, "holiday" is very noticeable. Many employees take time off around the holidays, and many people are off around Christmas and New Year's. These days off may have given employees fresh energy to return to work satisfied and engaged.
When delving into the reasons behind negative moods, "sleep" is very noticeable. In these dark winter months, rest and sleep are extra important to have sufficient energy. When employees lack sleep, it can lead to fatigue at work and long, strenuous workdays. This results in more negative moods among employees.
Take action
These findings indicate that sufficient rest contributes to positive moods. Days off and vacation contribute to employees experiencing more positive moods. Adequate sleep and rest can lead to fewer negative moods.
As an employer, you can support employees in these facets to ensure more job satisfaction. Tips for employers include: flexible working hours, encouraging vacation days, opportunities for power naps at work, and clear communication about rest periods. Encourage employees to take sufficient rest; this makes them happier and more productive!
Do you want to monitor the workplace happiness and engagement within your own team? Request a free quick scan here.
It's time again for the 2DAYSMOOD mood-monitor! We dive deeper into how employees felt during the month of December.
Mood in December
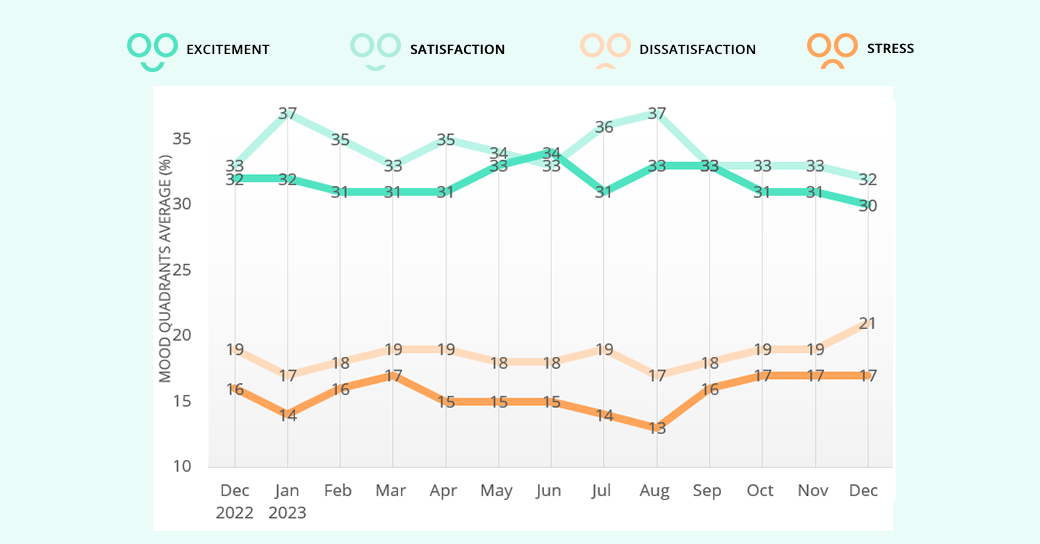
We observe that employees experienced 62 percent positive moods in December, meaning that 38 percent of employees experienced negative moods. We note an increase in negative moods compared to November. How is this negative trend specifically manifesting? Let's dive into it!
Within the positive moods, employees were, on average, 32 percent satisfied, and 30 percent engaged. This represents a 1 percent decrease in both positive moods. Within the negative moods, employees were, on average, 21 percent dissatisfied, and 17 percent stressed. The percentage of stress experienced by employees in December is the same as in November. Meaning that what contributes to the more negative trend this month is the 2 percent increase in dissatisfied moods among employees.
While comparing to the moods in December of the previous year, we see that the moods then were considerably more positive. Employees were more enthusiastic and engaged than this year. They were also less stressed and, especially, less dissatisfied.
The mood balance should ideally be 75% positive and 25% negative for teams to function optimally. Last month, it was mentioned that a shift of 11 percent towards positive moods was needed to achieve this ideal; now, this has become 13 percent. It's not a good sign that the mood trend is moving more towards negative emotions.
Within the negative emotions, the percentage of stress (17 percent) still falls between 10 and 20 percent, which is optimal for workplace performance. The shift towards more dissatisfaction is, therefore, a genuinely negative phenomenon. It is crucial for employers to be aware of this negative trend and actively address it.
Reasons for the Mood
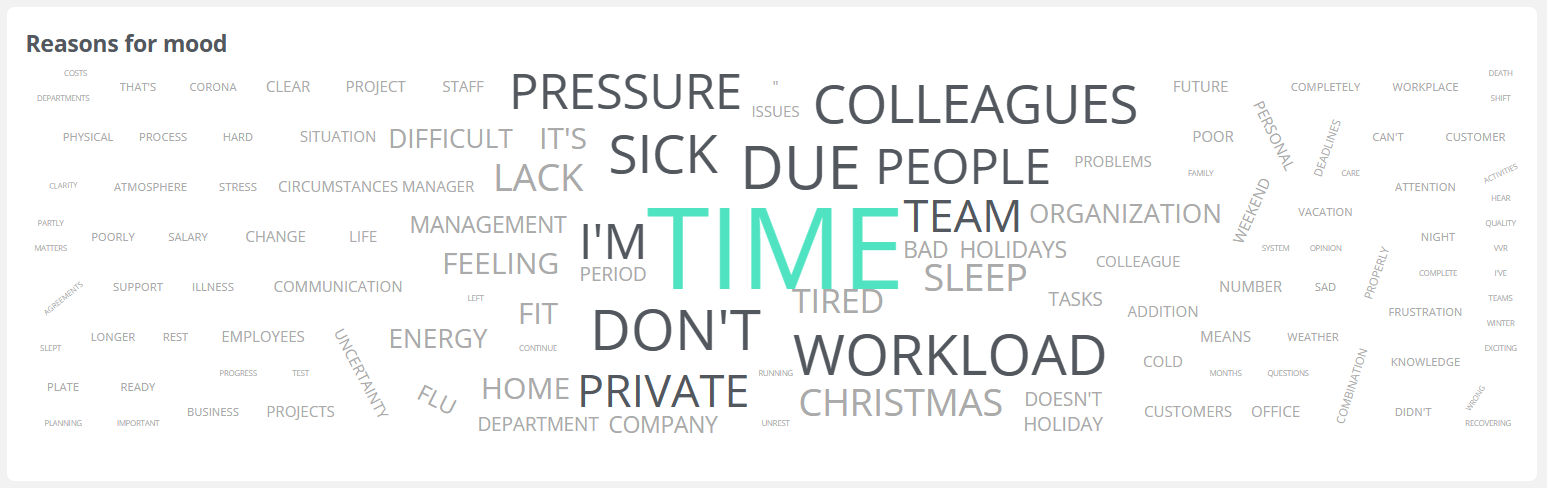
In addition to their emotional state, employees using our 2DAYSMOOD software tool indicate the reasons behind their moods. To delve further into what might be causing the negative mood trend, we have compiled these reasons into the word cloud below. What stands out prominently here is ‘workload’, 'pressure' and ‘time’.
It's possible that in the month of December, employees may need to complete projects before the new year, adding pressure. Additionally, December brings many holidays and private obligations, potentially leaving less time for work and creating a sense of pressure or 'not enough time.' As an employer, be aware of the extra challenges that the month of December may pose and try to support employees in navigating them.
Take action
In the data, we observe a negative trend towards increased dissatisfaction. This elevated level of dissatisfaction negatively impacts team performance. Therefore, as an employer, it is crucial to address this issue! How can you do this effectively?
- Listen to feedback
Foster open communication and encourage employees to share their concerns, ideas, and feedback. Regularly organize meetings, surveys, or feedback sessions to understand what is on employees' minds. Take the feedback seriously and demonstrate your willingness to listen and take action based on their input. - Engage with employees
By showing that you value the opinions of employees and actively responding to their needs, you create a culture of mutual respect and trust, ultimately enhancing overall satisfaction.
Learn more about the power of feedback and improved performance in the workplace in the 2DAYSMOOD knowledge blog.
It's time again for the 2DAYSMOOD mood-monitor! We dive deeper into how employees felt during the month of November.
Mood in November
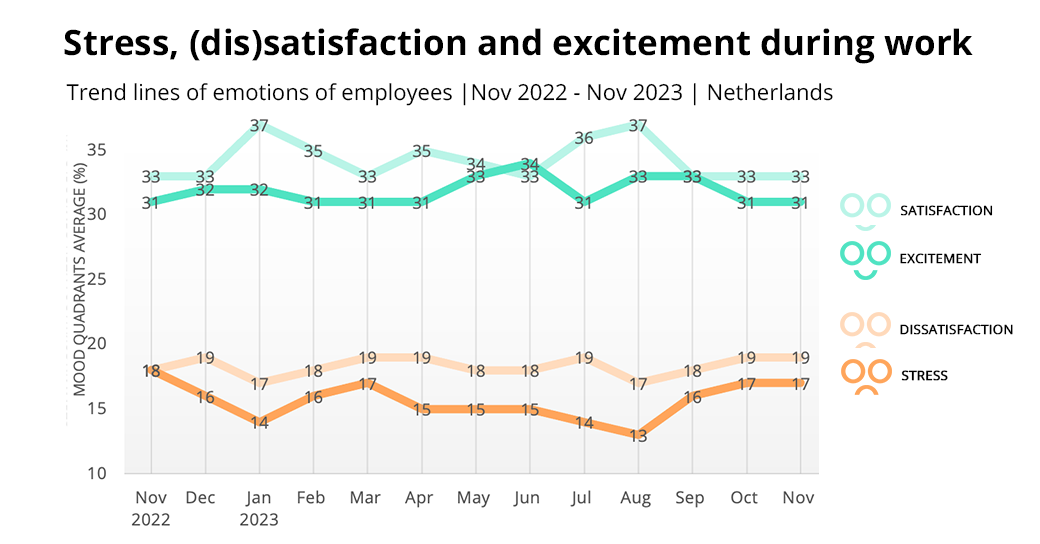
We observe that employees experienced 64 percent positive moods in November. This also means that employees experienced 36 percent negative moods. What is remarkable is that this distribution was the same in October of this year.
Let's take a closer look at the moods of the past month! Within the positive moods, employees were, on average, 33 percent satisfied and 31 percent enthusiastic. Within the negative moods, employees were, on average, 19 percent dissatisfied and 17 percent stressed. This distribution is once again identical to the month of October. This means that the mood trend remains stable.
Comparing to November of the previous year, we see that this year's moods are distributed almost identically. The only difference is that employees were slightly less dissatisfied last year, and in return, they were slightly more stressed. However, we are talking about a 1 percent difference compared to this year.
The mood balance should ideally be 75% positive and 25% negative moods. Then teams function best. So, an 11% shift towards the positive moods is needed moods to help teams perform optimally. Within this divide, stress between 10% and 20% is optimal for performance in the workplace. This means that especially the degree of dissatisfaction is a point of attention for employers!
Reasons for the Mood
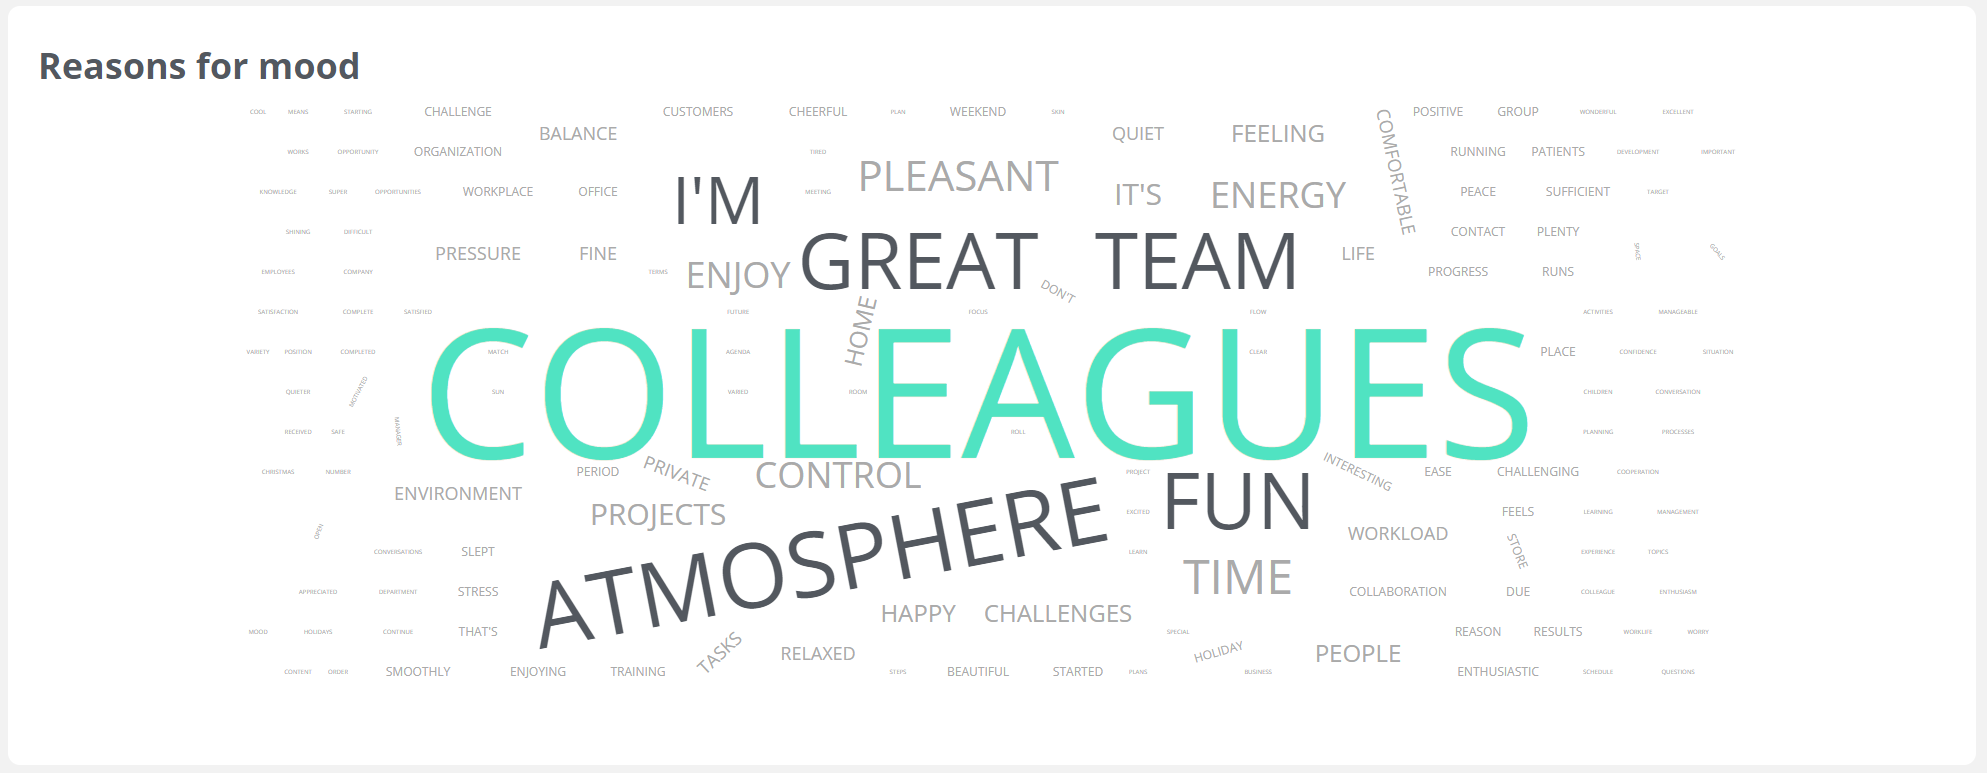
In addition to their mood, employees using our 2DAYSMOOD software tool indicate the reasons behind their mood. In the word cloud below, we have compiled all the reasons behind employees' positive moods. What really stands out here is colleagues! In the dark and rainy month of November, colleagues played a significant role in making employees feel happy at work. This aligns perfectly with the driver Relationship with colleagues from our Employee Happiness Model.
Take action
Boost workplace happiness during the rainy and dark days! Encourage your team to take a stroll together during lunch breaks. This not only promotes physical health but also provides the much-needed dose of daylight. Walking and chatting together strengthen team spirit. Since colleagues are the primary source of positive moods, this can create an additional bonding moment for happier employees. A simple walk can work wonders for the energy and workplace happiness of your team! A win-win-win situation.
When we look at the mood trend, we observe that last year, positive moods increased, and negative moods decreased in December. With all the festivity of the holidays ahead, we expect employees to be even happier in the coming months!
Want to know quickly and easily how your employees are doing? Do the measurement and receive useful insights!
October has arrived, and we are once again sharing the interesting findings from our Happiness monitor with you. In the month of October, we observe notable shifts in the mood of employees. While September saw a significant decrease in positive emotions, October continued this trend; 64 percent of the emotions are positive, and 36 percent are negative. This represents a slight decrease in positive emotions compared to September.
Remarkably, employee satisfaction has remained relatively stable in the month of October, with no significant changes compared to the previous month. Enthusiasm decreased slightly by 2 percent, with now 31 percent of employees still enthusiastic about their work, compared to 33 percent last month.
On the other hand, both stress and dissatisfaction increased by 1 percent, resulting in a stress level of 17 percent in October and dissatisfaction at 19 percent.
Various factors can contribute to these changes. October often marks the beginning of the autumn season, with shorter days and changing weather, which can influence people's moods. Additionally, ongoing challenges in the external environment can impact employee well-being and contribute to increased stress and dissatisfaction.
Take action: October can be a time when colds are lurking. When employees are not feeling entirely well, this can also lead to negative moods. As an employer, maintain a supply of healthy snacks and tea in the office to help your employees defend themselves against colds in the fall. A warm cup of tea and some vitamin-rich snacks can be a welcome addition to the autumn months and support the overall health of your team. Furthermore, you can support your employees by encouraging remote work when they exhibit mild flu symptoms. This way, you can prevent the entire team from being sidelined soon!
Let's work together to promote more positive emotions in the coming months, so we can end the year with enthusiasm and zeal. With the right support and initiatives, we can strive for a healthy and satisfying work environment.
Do you want continuous insight into how your employees are doing?
Take the survey!
September has arrived, and we would like to share the latest engagement monitor results with you. After the summery vibes of August, it seems that the mood among employees has somewhat shifted. Let's take a look at the numbers for September.
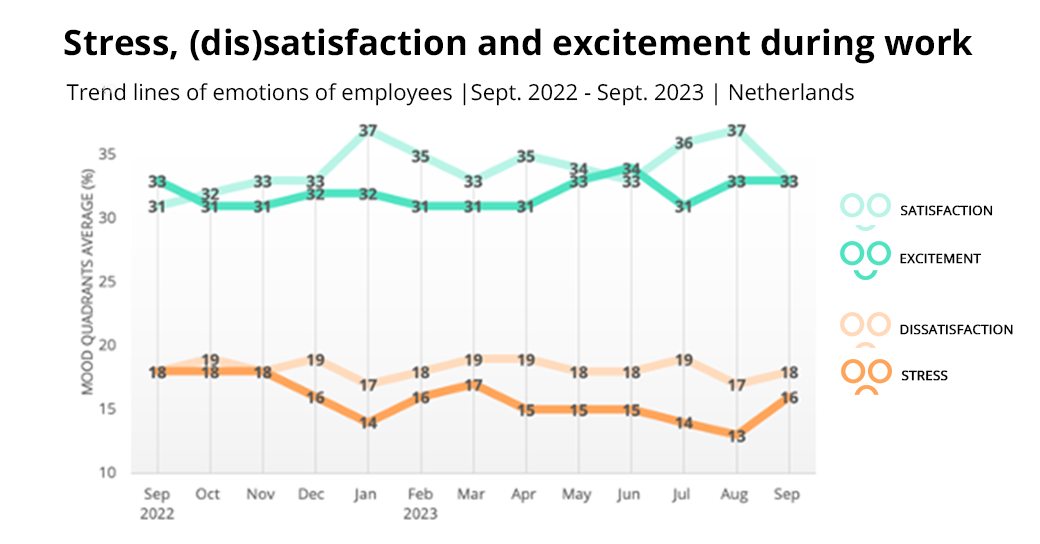
In September, we observed a shift in employees' mood. While August was characterized by a predominance of positive emotions, there was an increase in negative emotions in September. Now, 66 percent of emotions consist of a positive state of mind, while 34 percent are occupied by a negative state of mind. This marks a 4 percent increase in negative emotions compared to August.
The distribution of enthusiasm has remained the same, with 33 percent of employees being enthusiastic. However, satisfaction has dropped from 37 percent in August to 33 percent in September. Additionally, what stands out is the increase in stress among employees, which has risen to 16 percent, compared to 13 percent in August. Furthermore, dissatisfaction has also increased by 1 percent, reaching 18 percent.
There can be several factors explaining these changes. September can be a busy month for many, with the end of the holiday season and the return to daily routines. This can lead to an increase in stress and dissatisfaction. Moreover, the transition from summer to autumn can also have a negative impact on employees' moods.
It's important to monitor these changes in employees' moods and consider how your organization can respond to support the well-being of your employees. Perhaps measures such as flexible work schedules or well-being initiatives are needed to reduce stress and promote satisfaction. For example, you can refer to our blog on the four-day workweek and apply this as a way to increase job satisfaction and employee engagement.
Let's work together to ensure that the coming months take a more positive turn and find ways to restore the balance between positive and negative emotions. Autumn has officially begun, so with some extra support, we can continue to strive for a healthy and fulfilling work environment.
Would you like to know how the 2DAYSMOOD-tool can help you decrease stress at work? Contact us for a free demo.
August has arrived, and the results of the engagement monitor bring good news for people in workplace. Summer is still in full swing, but it seems that the sun is shining not only outside but also in the hearts of many employees.
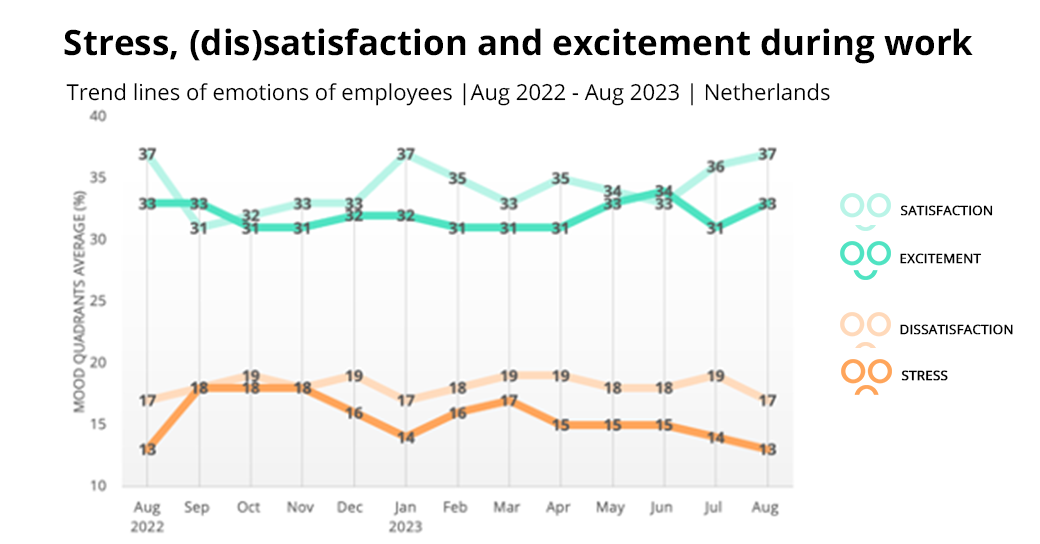
Let's take a look at the figures for August. It's clear that a positive change has occurred compared to July. We see a distribution of 70% positive emotions compared to 30% negative emotions.
In August, a whopping 37 percent of people were satisfied, which is an increase compared to the 36 percent in July. Enthusiasm has also gained ground, with 33 percent of respondents indicating enthusiasm about their work, a increase from the 31 percent in July.
Negative emotions have significantly decreased. Only 17 percent of people reported being dissatisfied, a decrease from the 19 percent in July. Stress has also decreased to 13 percent, compared to 14 percent in July. It seems that the worries and frustrations of July have given way to a more relaxed and positive atmosphere in the workplace.
These changes can partly be attributed to the vacation period, which provided a well-deserved break for many and the opportunity to recharge. A more laid-back atmosphere now seems to be making way for renewed motivation after the summer break. What stands out is that last year in August there was the exact same mood trend!
So, let's enjoy the summer vibes and continue this positive trend in the coming months!
Take action: Are you struggling to maintain your post-vacation motivation? Then we have three tips for you! First, set clear goals for yourself so that you have a clear direction for the coming months. Second, don't forget to take short breaks throughout the day to refresh your mind; this will benefit your productivity. And finally, celebrate your successes, no matter how small they may seem. This will boost your motivation and remind you of the value of your efforts. With these tips, you'll stay motivated and focused as you face the challenges of work after a well-deserved vacation.
Curious how you can measure happiness at work? Contact us for a free demo.
Summer is in full swing, but in the past month we in the Netherlands have been wet with rain rather than with sweat…
The month of July is over. For many, a month in which you may have been on holiday to a 'sunny place' and returned with a tanned face. But for the people who stayed in the Netherlands it was unfortunately often impossible to enjoy the sun.
Enough about this, haha! We are going to see what the happiness levels of employees look like.
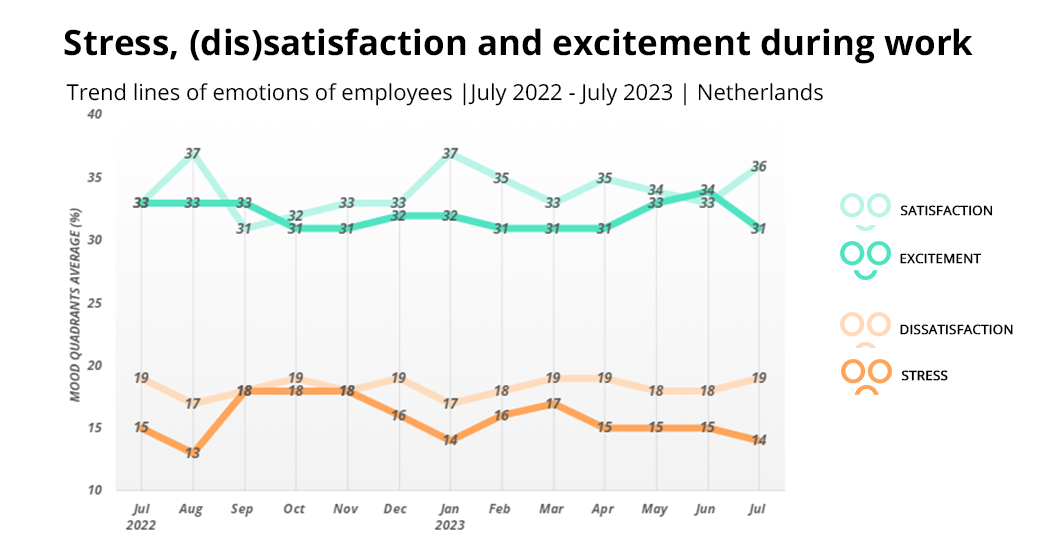
When we dive into the data, we see that there is a distribution of 67% positive emotions versus 33% negative emotions. This therefore remains stable compared to June.
If we look at the positive emotions, we see that there has been a shift that causes satisfaction to rise to 36% (+3) and engagement to fall to 31% (-3). Within the negative emotions, we see that stress has dropped to 14% (-1) and dissatisfaction has risen to 19% (+1).
So, we see that both the positive and negative quadrants show lower energy scores than last month. Perhaps this more laid-back mood is due to the holiday period, which is also a quieter time in terms of work in many professions. So, no problem at all to be a little lower in energy sometimes. Below is a tip to find the motivation to get back to work after your holiday!
Take action: A tip to get fresh energy when you get back to work after the holidays is to create an inspiring workplace! This can be done on location, but also at home when you work remotely. Choose some elements that energize you, such as vibrant plants that brighten up your room. Hang up pictures of your adventures to capture that positive holiday energy. And don't forget motivational quotes.
Did you know that this not only brightens up your workplace but can also give your energy and motivation a big boost? An environment that accommodates you helps you to switch to work mode faster and helps you to get started with fresh energy.
So, get started and make your workplace a place where you not only work but also get inspired. You will find that your holiday energy will stay with you for a long time to come!
Would you like to monitor and improve Happiness at your workplace? Request a free quickscan here.
Last June was the warmest and sunniest June on record in the Netherlands. Never before have there been so many summer days in the month of June! What does that do to work happiness ?
Looking at the numbers we see that the overall happiness level remains stable at the nice value of 67%.
Within the distribution of positive emotions we see that the number of engaged employees rises to 34%! Last month this also increased and so this continues within June. Nice to see that a "little more" vitamin D is good for us after all. Looking at the distribution of negative emotions experienced, we see that it has remained the same.
As you may have experienced yourself at work, a little healthy stress 'at times' is quite functional to get things done. So perhaps a good goal for July is to get not necessarily the experienced stress, but the dissatisfaction down! Shall we go below 15%?
Lets go!
Take action: take a look around you to see who among your immediate colleagues could use a helping hand and/or try to look for the positive aspects in your own work, in addition to the things you don't like. And, a smart tip from our Organizational Psychologist: ever heard of job crafting? Perhaps there is a task that you find unpleasant, while a colleague get energized by it. In this case, it might be smart to give up or swap that task! Job crafting is about adapting the work environment to fit your own skills and interests.
Would you like to monitor engagement within your own team? Then request a free quickscan here.
In May we see that the slight increase continues! The overall happiness level reached a great level of 67%.
If we look at how the distribution of positive emotions is built up, an increase in mood engagement is visible. Nice to see that this even increases by 2% compared to last month! As a result, it is possible that the group of employees with the mood of satisfaction has become somewhat smaller. (But for good reason!)
When we look at the distribution of negative emotions, we see that this group has become smaller. We also see that the percentage with the mood dissatisfied has (fortunately) decreased, but that the employees still report the same percentage on the mood stress.
In the end, nice numbers! We are very curious whether this sunny trend will continue!
Do you want to measure the mood within your organization? Or are you curious about how the tool works? Request a demo here.
If we look at our data from last April, we also see the "typical" (annual) positive turnaround in this month. Summer is coming: the days are longer again, the birds are singing, we are less stressed and we have some extra positive energy! This is reflected in an increase in the overall happiness level to a distribution of 66% positive emotions versus 34% negative emotions.
This turnaround is mainly due to the increase in mood satisfaction (plus 2%). We remain the same on the mood engagement, in the end we are more positive in the workplace! Nice to see that stress has decreased (minus 2%) and dissatisfaction also seems to be less (but not yet enough for 1 whole percent). So we still score those the same as last month. So all in all, a nice positive trend.
Nice to see that we have found the way up again!
Do you want to know what's going on in the workplace? Whether your actions and steps are successful and how the team feels about them? Request a demo here for direct insight.
The first quarter is behind us again! In March, we see a slight decrease in the overall level of job happiness. We end up at a distribution of 64% positive emotions versus 36% negative emotions (last month it was 66%).
When we look at the distribution of emotions based on the quadrants of mood, we see that this has come from a decrease in mood satisfaction (minus 2%). As we remain the same in terms of engagement in March, this causes a slight loss of ground for the positive emotions.... Unfortunately!
What declines on the positive side in March increases on the other side: the 2% increase comes from a cumulative rise in dissatisfaction (plus 1%) and stress (plus 1%).
With this, the quarterly close shows a downward trend, so we need some new fresh energy!
Take action! Fortunately, we are on the eve of an extra long Easter weekend. So everyone: enjoy it! Take care of the fresh look for a while and think about what will get you back into the positive "flow".
Do you want continuous insight into how your employees are doing? Take this measurement and get the conversation started!
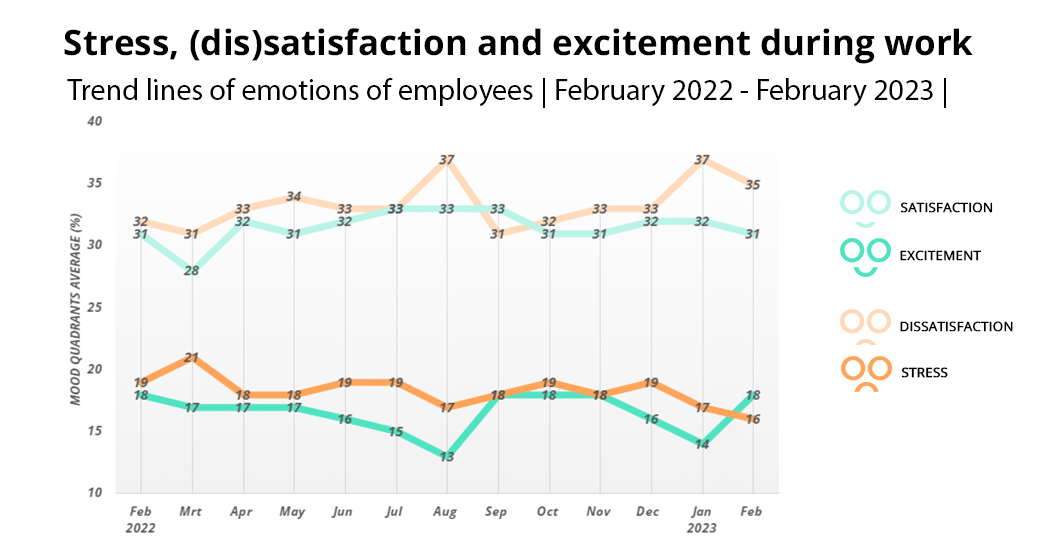
It's time again for the monthly update regarding the perceived happiness of working people in the Netherlands! February is behind us. A month in which 'the new year' just became 'this year' again.
Looking at the figures, we unfortunately see a decrease in the overall level of work happiness (by 3%): to a distribution of 66% positive emotions versus 34% negative emotions.
This is mainly caused by an increase in stress to 16% (plus 2%) and an increase in dissatisfaction to 18% (plus 1%). Of course, we surrender this on the positive side: in the area of engagement, we arrive (with minus 2%) at a score of 35% and in satisfaction we arrive at a score of 31% (minus 1%). We also see this on the other positive side in the statistics. Engagement decreased by 2% to arrive at a score of 35%. Satisfaction decreased by 1% and here we arrive at a score of 31%.
Hopefully this downward trend will not continue in the coming period, but we can 'turn this around' in the coming month of March. We have started the year well and on average we are still in good shape, especially if we also look at last year.
We notice that organizations respond positively by, for organizing fun team activities for example. This contributes to the energy and mutual informal connection at work among employees. Have you already planned a team activity for your employees?
Do you want continuous insight into how your employees are doing? Take this measurement and get the conversation started!
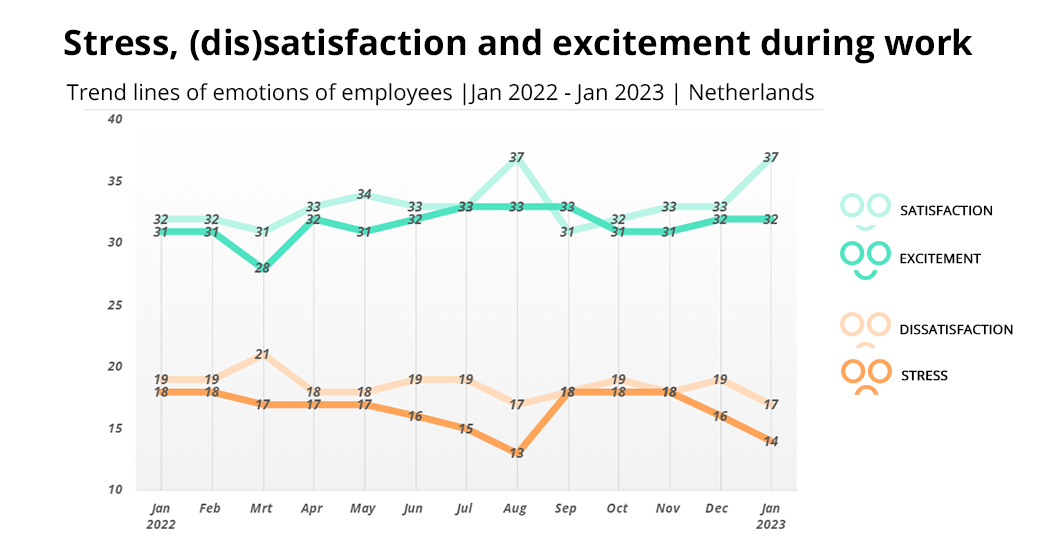
We kick off 2023 with a flying start! The figures for January show a fantastic trend of employees at work. This is exactly what we have been hoping for. We are going into the new year high in energy and fun.
We immediately start 2023 by matching the highest point on satisfaction of 2022 (and an increase of plus 4% compared to last December): a great entry with 37%! We also maintain the high score in the area of work engagement, namely 32%. Dissatisfaction and stress both decreased by minus 2% to 17% and 14% respectively. Eventually this brings us to a distribution of 69% positive emotions versus 31% negative emotions.
Positive ground has therefore been gained, right from the start of 2023. Are you, like us, curious whether this positive trend will continue? We have the feeling that 2023 can be a very nice year!
Which drivers can influence happiness at work? Read more about the drivers of happiness at work in the Employee Happiness Model. These drivers help you as an HR manager or team leader to make concrete and targeted improvements in order to retain your employees and demonstrate good employment practices.
2022 is behind us and as you are used to, we are reflecting back on the mood data for perceived happiness at work. At the end of the year, we have something special: an extra extensive analysis!
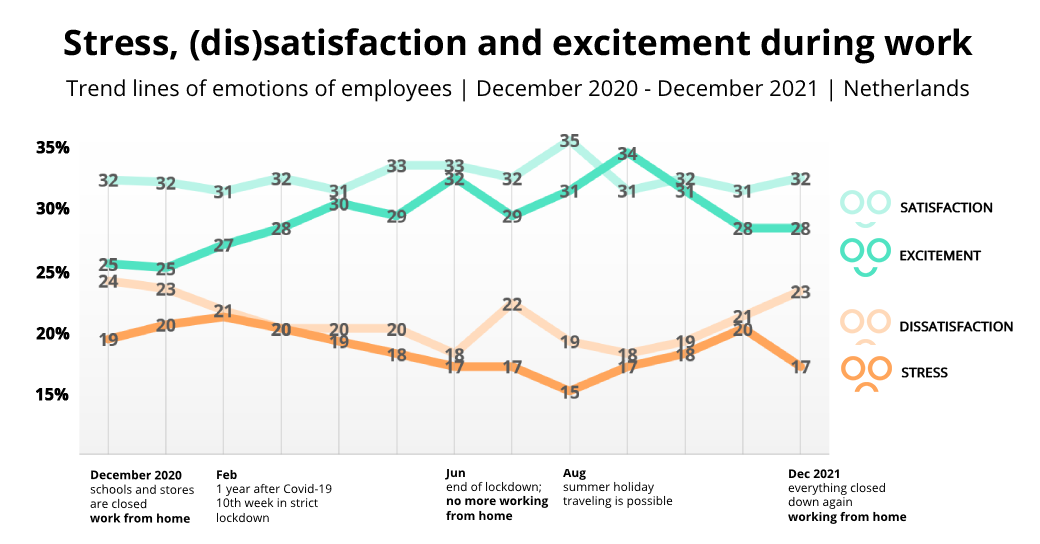
We don't just take you through the mood data of the month of December. We also look at the differences between December 2022 and December 2021. In addition, we compare last December with the mood data of the past year. Read more below.
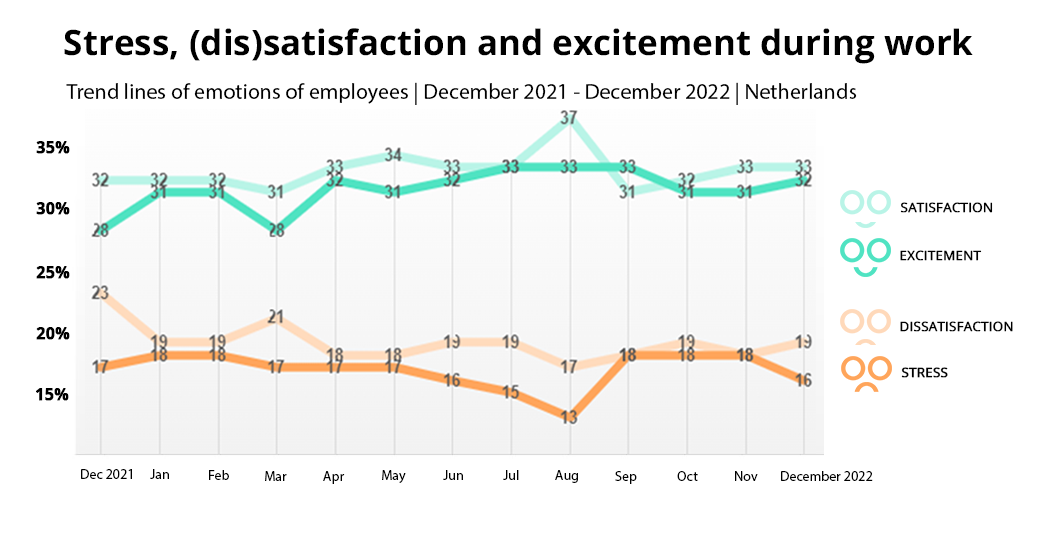
December 2022
When we look at December, there is a positive trend. Engagement rises a little further to 32% and satisfaction remains the same at 33%. Dissatisfaction does rise slightly to 19%, but stress, on the other hand, falls by 2 points to 16%. Compared to November, this results in a further increase in the general distribution of 65% positive emotions against 35% negative emotions. So in the end, we close the year well!
December 2022 vs. 2021
We see a positive increase when we compare December 2022 with the average score of the year before. With a percentage of 32%, enthusiasm in December is higher than in an average month (31%) and stress is also lower than average in December (16% versus 17%).
Compared to December 2021, we see a positive trend. Dissatisfaction is no less than 4% lower in December 2022 than in December 2021 (19% versus 23%). Furthermore, satisfaction is 1% higher (33% versus 32%) and stress is 1% lower (16% versus 17%). And if we finally look at engagement, then that percentage is also no less than 4% higher (32% versus 28%)!
December vs. last year
As already mentioned, the picture is positive compared to last month of November. But how does December compare to the rest of last year?
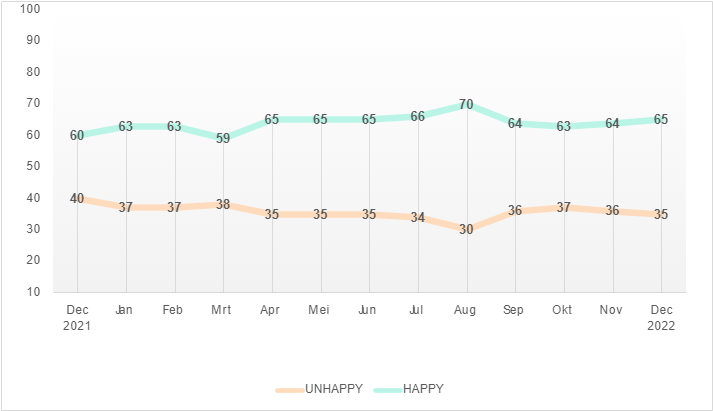
A few numbers to summarize last year:
- The average for positive emotions was 64%
- The highest score for positive emotions was 70% (August)
- The lowest score for positive emotions was 59% (March)
- We started the year 2022 with a percentage of positive emotions of 63%
- In the month of December 2021, the percentage of positive emotions was 60%
This indicates that December was on average a positive month in the past year, also in this general distribution of positive emotions (1% above average) versus negative emotions (1% below average).
Here too it is good to see that we have an upward trend this year. Based on the figures, it can be said that we will close the year 2022 with a 2% higher percentage of positive emotions (65% versus 63%). And especially if we compare it to how we were doing in December 2021, an increase in positive emotions of no less than 5 % (65 % versus 60 %)!
2022: 'new' and positive
2022 was a year in which we were allowed to get used to our 'normal life' again, including in the field of work. We now know that working from home (whether or not hybrid) is indispensable. Furthermore, a selection of other important themes: the tight labor market, sustainable employment practices, diversity, inclusion and solidarity in the workplace. We are still getting used to the 'new'!
Looking back on the year, it was a positive year in terms of perceived happiness at work! Flexibility was needed from us, but in the end this year has paid off for us. We are on the upward trend and are closing the year on a higher note than we started! And what a nice growth compared to the year-end December last year!
We are now starting a new year with mostly positive energy: 2023! What are your good intentions for upcoming year? In any case, we have listed the most important HR trends for 2023 for you. It’s time for a fresh start!
Do you want continuous insight into how your employees are doing? Do the measurement and start the year off right! Try it now and get ready for 2023!
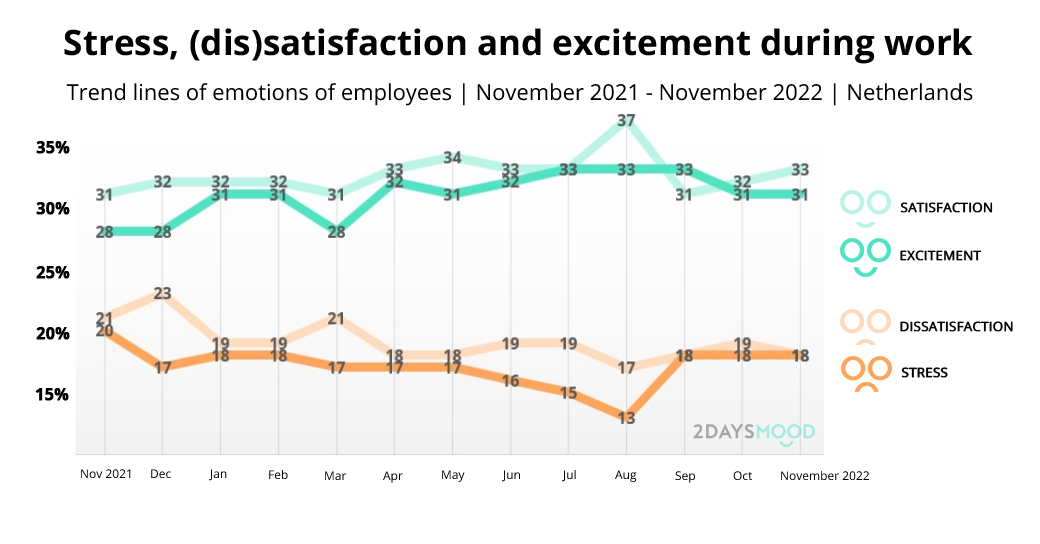
The month of November is over, and so we look back at the mood data. It seems that winter is now approaching: it gets dark early, a lot colder and the holidays are getting closer. What does that do to the moods of employees?
In that respect, we see a fairly positive picture. Satisfaction rises slightly further to 33% and engagement remains the same at 31%. Dissatisfaction drops to 18% and stress also remains at 18%. All in all, this results in a distribution of 64% positive emotions against 36% negative emotions. That's a nice spread for this time of year.
Although we saw a rapidly rising negative mood in September, that trend now officially seems to have discontinued. The distribution of positive and negative emotions has remained stable in recent months. It seems like a good time to reflect on the past year with your employees: what did their moods look like throughout the year? What did you do together to respond to that? Also collect feedback from your employees for the upcoming year. How can you make even better use of the data you collect? All in all, a nice moment to sit together and start a conversation.
With the data from 2DAYSMOOD you always have the right conversations. Try it now and get ready for 2023!
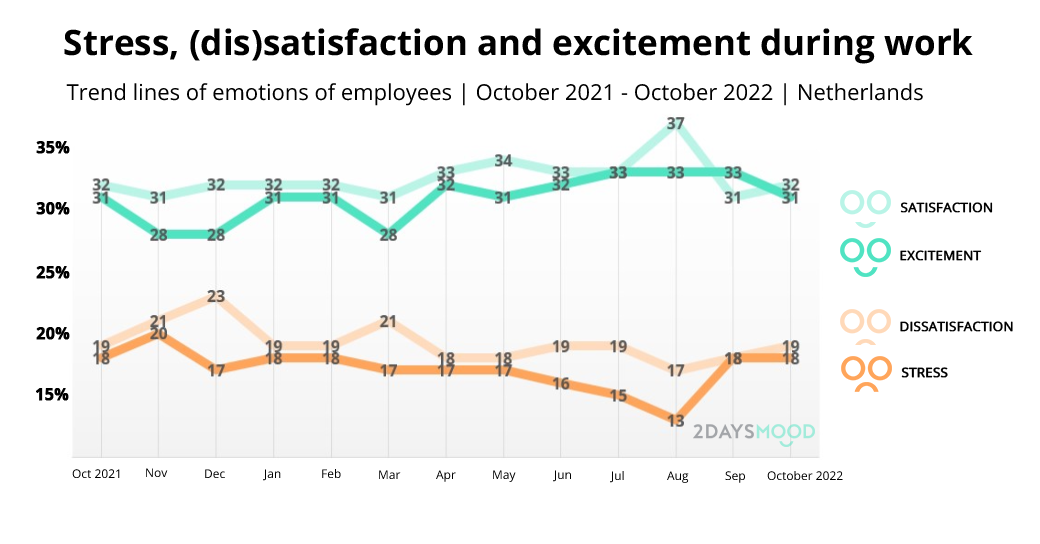
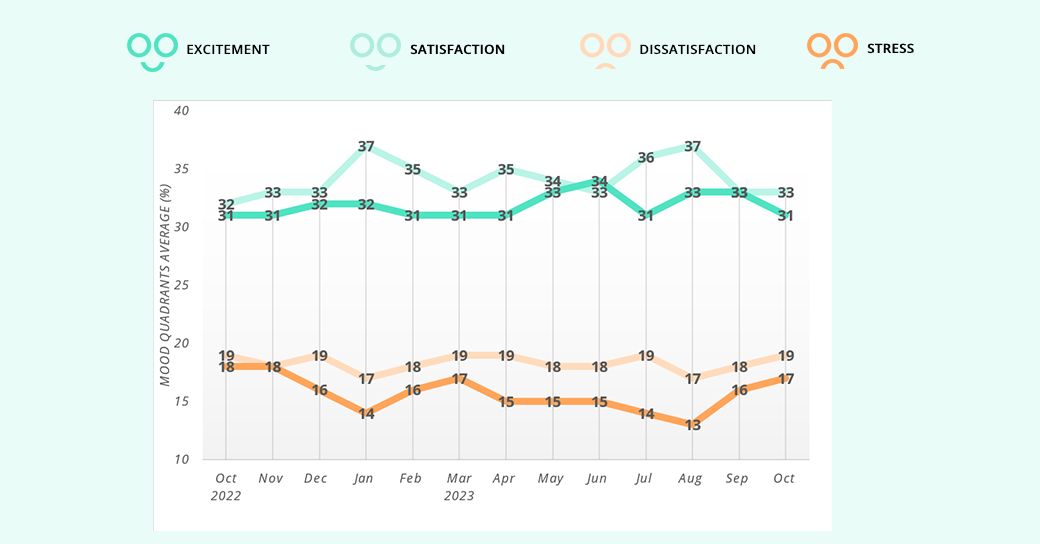
What did the excitement, (dis)satisfaction and stress of employees look like in October 2022? We can see that negative moods are rising slightly - the days are getting shorter and the wonderful late summer is now really over. We also often see that the last quarter of the year is a bit busier for many employees, so that could be an explanation for the higher dissatisfaction and stress. But don't worry: the positive mood is generally still high.
Satisfaction rises to 32% and excitement decreases slightly to 31%. Dissatisfaction rises to 19% and stress remains the same at 18%. All in all, this results in a distribution of 63% positive emotions against 37% negative emotions. We certainly should be satisfied with that distribution!
Although the last months of the year are a bit busier, it is good to keep track of your employees’ moods. A busy period is normal, but negative emotions should not take over. Do you see that? Then you have to intervene quickly, so that you prevent burnouts in time!
Do you want continuous insight into how your employees are doing? Take the measurement and get usable data quickly!
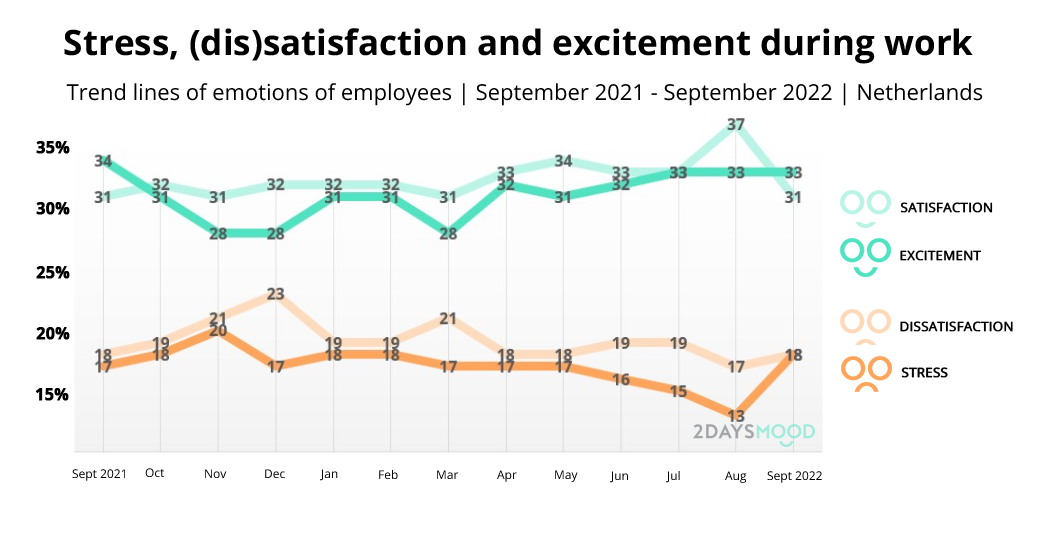
The summer months are over, and it shows. Although we are still enjoying a beautiful late summer, it is really time to get back to work. And most employees have busy months ahead of them. The time to put our shoulders to the wheel again is reflected in the engagement data for September.
Don't be alarmed, because we actually already expected this image. Satisfaction drops quickly to 31% and engagement still stands at 33%. Dissatisfaction rises to 18% and stress rises quickly to 18%. This brings us to a distribution of 64% positive emotions versus 36% negative emotions. And that's quite a difference from last month, when we saw a 70/30 split.
But that's not so crazy at all. The holidays are over for most people. The darker, busier months are coming. After the quiet summer months, there is suddenly a lot of work that needs to be done, and we would probably prefer to leave for the sun. This can lead to lower satisfaction and higher stress levels. But isn't that shift going too fast? Keep a close eye on how your employees are doing. We now desperately need the energy we have recharged.
Want to know quickly and easily how your employees are doing? Do the measurement and receive useful insights!
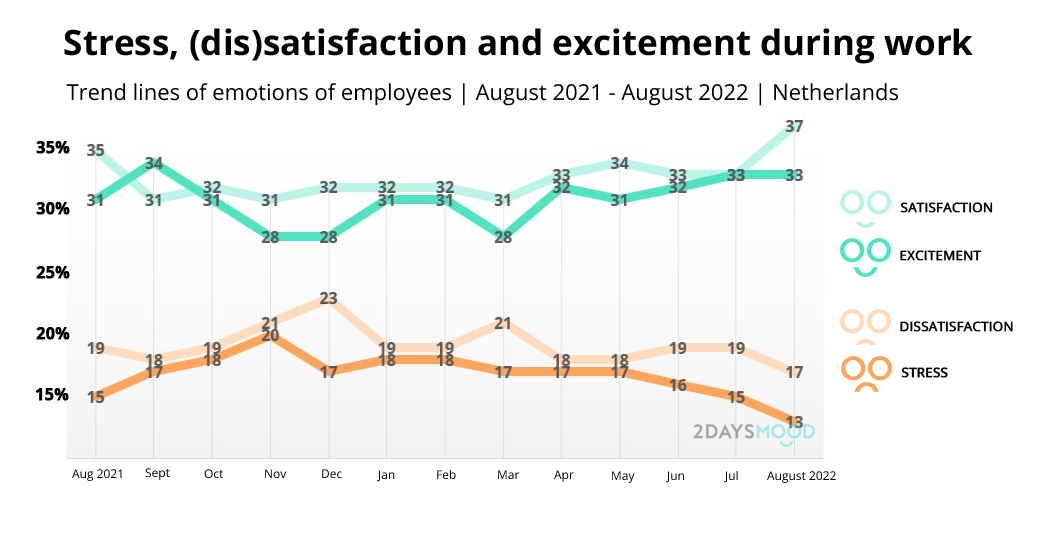
What does your summer look like? Relaxed, taking a vacation, fully recharging and getting back to work? Then you're not alone. Because the happiness at work data of August shows a beautiful picture of employees in the Netherlands. Exactly what we want to see during these months!
There is a significant shift visible this month. Satisfaction shoots up to 37% and engagement remains the same at 33%. Dissatisfaction drops to 17% and stress goes even lower, to 13%. All in all, this results in a distribution of 70% positive emotions against 30% negative emotions. We only came close to this distribution in January 2020 (back then it was 69/31), but we have never seen so many positive emotions before.
It is clear that we use the summer for what it is meant to be: enjoying, resting, taking vacations and so on. This is exactly the data we want to see in the summer. In August 2021 we saw a similar picture, but according to the data of 2020 and 2021 we could not relax as much as we do now. And that's essential to recharge for the busy months ahead.
Keep the positive emotions going! Take the measurement and quickly gain insight into the moods of your employees
Summer is in full swing! The weather is nice, we enjoy the long days and the sun, and can finally go on holiday like normal again. That these things are likely to benefit any individual seems logical. But what does the happiness at work data say about July?
The positive and negative emotions shift only slightly. Satisfaction remains the same at 33% and engagement rises slightly to 33%. Dissatisfaction remains at 19% and stress drops to 15%. All in all, this results in a distribution of 66% positive emotions against 34% negative emotions. That's a very nice distribution!
In the summer we often see some calmness in the data of the working Netherlands. The summer months are often less hectic. We can take a break and recharge for the last months of the year. But you still have to make sure that you are well prepared for the last quarter, because that is when fatigue is lurking!
Want to take on the summer well prepared and with useful insights? Take the measurement and get handy data quickly!
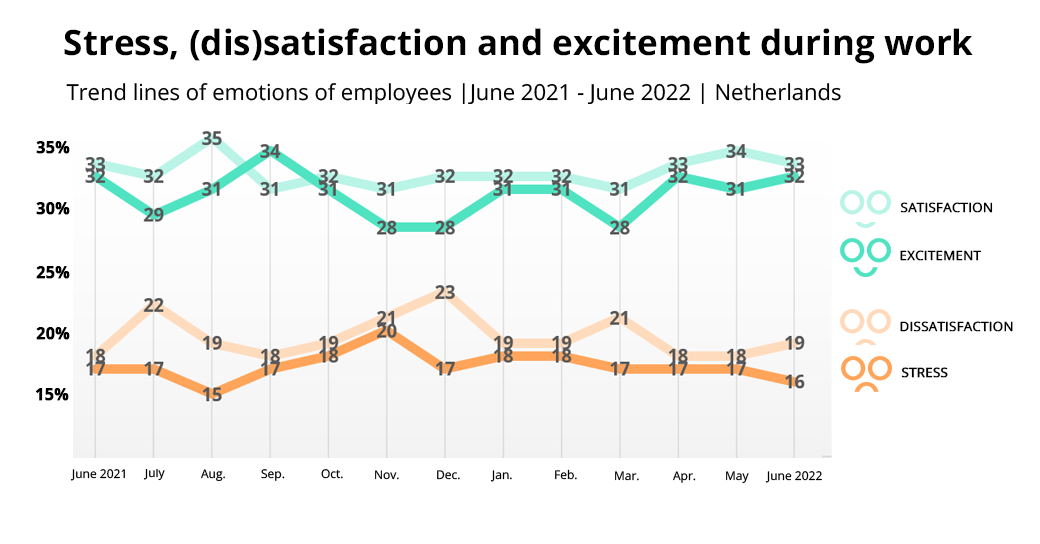
The summer has begun! Check out the engagement monitor update for the month of June here. The summer months are generally somewhat quiet and we see a decrease in stress and increase in engagement in June. In contrast, the level of dissatisfaction increased.
How do you create more job happiness and engagement in the workplace? Read here how to do it in 15 steps.
Check out the engagement monitor update for the month of May. We see that stress and dissatisfaction have remained the same as the month of April. However, we did see an increase in the level of satisfaction and a decrease in engagement.
Are you curious how to raise engagement in the workplace? Then read our articles for insights.
Spring season has started and that does the employee a lot of good. The sun is shining, the days are longer, the birds are singing and we are outside more. In April we see an enormous increase in satisfaction and engagement in the workplace. We also see that dissatisfaction has decreased. The past quarter we saw organizations respond positively to dissatisfaction on the work floor. In the month of April we see the effect of this.
Are you curious about the 2daysmood software tool or do you want to do a test measurement? Then request a demo here for immediate insight.
The first quarter of 2022 unfortunately leaves some positive energy to be desired. In March we see an increase in dissatisfaction. Fatigue and gloominess have increased in this. In addition, we see a 3% decrease in engagement, where cheerfulness and enthusiasm have declined. In addition to the continuing high number of corona infections, we see that the weather is playing a negative role. The rainy weeks, along with the war in Ukraine and a continued high workload are causing an increase in dissatisfaction.
Fortunately, we also see a positive development! We notice that organizations are responding positively by organizing one team activity after another. This contributes to the energy, mutual connection on the work floor and fits in well with the need for informal contact. Have you already planned a team event for your employees?
Do you want continuous insight into how your employees are doing?
Take a measurement !
Finally, we are getting more energized at work again! There is talk of easing up again, and the carnival is even going on. Whereas fatigue, in particular, continued to increase significantly in recent months, we are now seeing a big drop there from 23% to 19%. In contrast, engagement (emotions high in energy and fun) increased by 3%, from 28% to 31%. That brings us to a distribution of positive vs. negative emotions of 63% vs. 37%. Hopefully this trend will continue in the near future, we all deserve to be able to go where we want at the office again.
Do you want continuous insight into how your employees are doing? Take this measurement and start the year off right!
Happy New Year! 2021 is behind us. A year full of uncertainty, lockdowns, relaxation, stricter measures, and so on. It has been an eventful year that has demanded a lot of flexibility from us. We now look back at the December voting dates. Last month, even stricter rules were announced and we ended up in a strict lockdown (without curfew).
Still, overall we see positive numbers compared to November. Satisfaction increases slightly to 32% and excitement remains the same at 28%. Dissatisfaction rises to 23%, but stress drops to 17%. And that is positive, because that means that the people who experienced stress in November have been able to let go of it a little. This could be related to the Christmas holidays and the rest period in December. All in all, we are now at a distribution of 60% positive emotions versus 40% negative emotions.
We are now starting a new year with mostly positive energy: 2022! Do you have new year's resolutions when it comes to work or will you take it day by day? In any case, we have listed the most important HR trends for 2022 for you. This way you are well prepared professionally. Time for a fresh start!
Do you want continuous insight into how your employees are doing? Take this measurement and start the year off right!
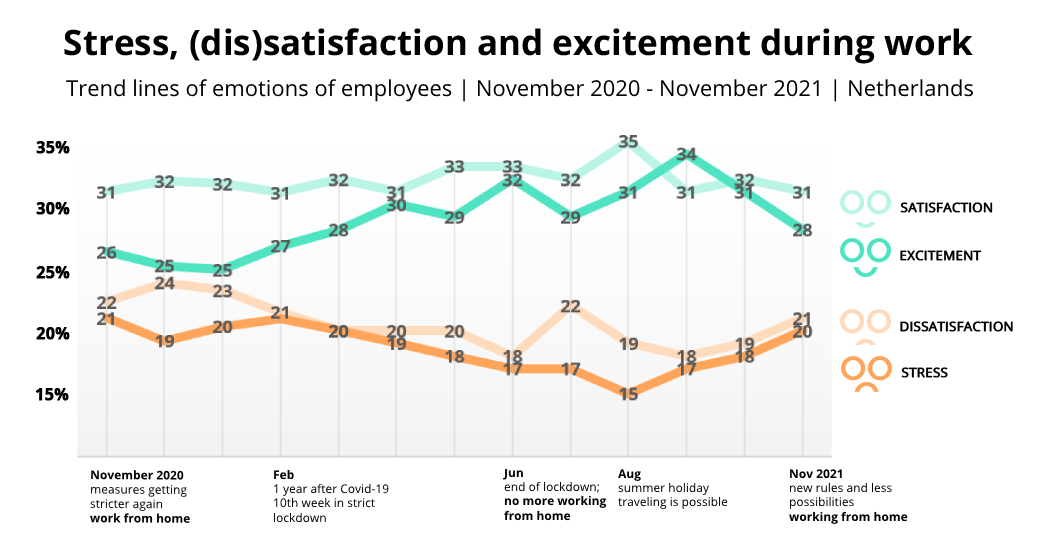
November is over, and so we look back at the mood data of the Netherlands. After stricter measures in October, they became even stricter in November: almost everything is now closed after 5 p.m. This causes a disturbed work-life balance, because after our working day we can do little more than sit on the couch and we have no time for other things such as hobbies.
And we see that reflected in this month's data: they show a bleak picture. We see the excitement drop further to 28%. Satisfaction also decreased slightly to 31%. In the field of negative emotions we see an increase: dissatisfaction rises to 21% and stress is not far behind with 20%. This puts us at a distribution of 59% positive emotions against 41% negative emotions. We haven't seen a distribution this bad since February.
Does that mean we're going back to a 50/50 split this winter? We'll have to wait and see. We hit this low last winter, when we had to deal with a curfew and even more uncertainty than today. What is especially important is that you keep checking with your employees how they are doing. Do you regularly engage in an honest conversation? Do they struggle with stress or do they miss colleagues in the office, and what could you do for them? Stimulate connection in your team by having online Christmas drinks this month and come up with something fun to do. Even though we may be tired of online games by now, it is important to maintain the team spirit. Then we can start 2022 with new energy!
Do you want continuous insight into how your employees are doing? Take this measurement and get the conversation started!
Autumn is in full swing! And that also has the necessary effects on the moods of employees and the infections in the Netherlands. Measures are being tightened up again and this is reflected in the happiness data of October.
Satisfaction rose to 32% in October, but excitement fell to 31%. The negative emotions rise again. Dissatisfaction rises to 19%, and stress to 18%. We now see a distribution of 64% positive emotions and 36% negative emotions.
This may be due to end-of-year deadlines, stricter (home-working) measures or simply the fact that it is darker longer. In any case, it is now extra important to keep your finger on the pulse and to enter into a dialogue with your employees.
Do you want continuous insight into how your employees are doing with the constant change? Then do the measurement!
September has already passed, and we've noticed: summer is really over and the rain doesn't seem to stop sometimes! We're now entering the last three months of the year, so we're looking back at the September mood data. And here we see that the work load (stress) for the last few months of the year is already increasing slightly. Do you have any projects that still need to be completed?
Fortunately, it is not entirely negative. Because although satisfaction drops to 31%, excitement rises to 34%. And look at the excitement line of the past year, what a great trend! Are we really recovering from Covid-19 (working from home, uncertainty, etc.)? In the negative moods we see that dissatisfaction falls to 18%, the stress increases to 17%. And that could be a sign of end-of-year stress. All in all, that means we had 65% positive emotions and 35% negative emotions in September.
Do you see many satisfied employees in your organization or team, but can the enthusiasm be even better? Take a look here for tips to increase the employee engagement!
Do you want to keep an eye on the workload of employees and maintain their excitement? Look here to get always relevant insights!
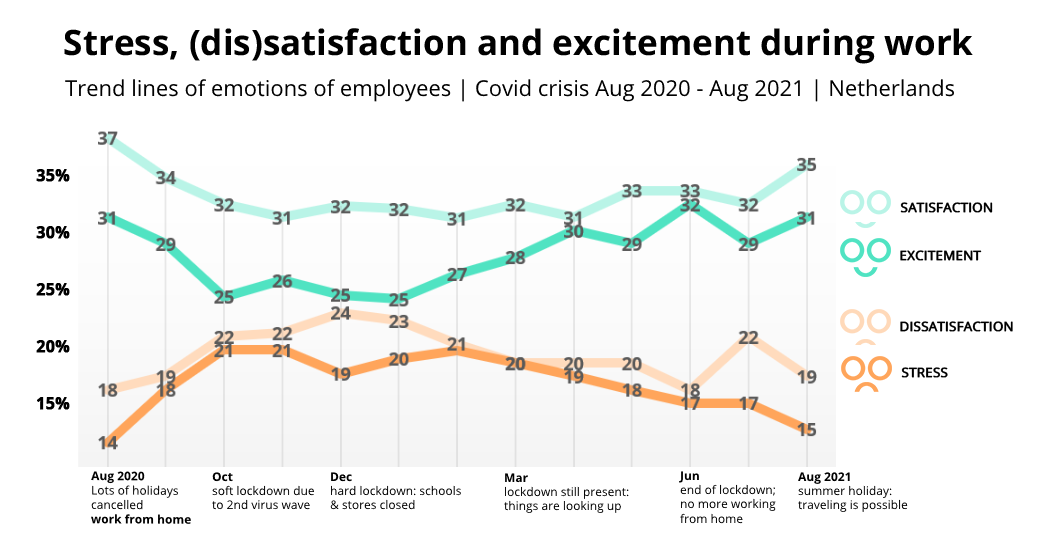
The summer vacation is already over! And so we look back at the mood data from August. Although we were hit with stricter measures again in July and we saw the negative emotions rise, moods now seem to be picking up again quickly. And that's good news, because that's exactly the trend we normally want to see after the summer.
In August, satisfaction rose by 3% to 35%. Enthusiasm increased to 31%. And luckily we see negative moods drop again: dissatisfaction dropped to 19% and stress to 15%. This means that we are now at a distribution of 66% positive emotions against 34% negative emotions!
In July, even though vacation plans were cancelled, we urged everyone to take a vacation and rest. And that seems to have worked. Now that the summer is over, we can get back to work with fresh energy. Do you have new employees on your team, who are eager to kick off their new job? Read below how you can properly guide them in the onboarding process. After all, well begun is half done!
Do you want insight into how new employees are doing and receive feedback on your onboarding process? Then do the measurement!
In the spotlight: give new employees a great start!
Starting a new job is and remains exciting for many people. As a team leader or HR manager you can already make the process a lot easier by facilitating a good onboarding. In July, a number of 2DAYSMOOD customers gathered during the HR mastermind to discuss their onboarding processes. They now share their best tips!
- Send a card to the new employee before he or she comes to work for you. On this, team members can write what they like about working in that team. A warm welcome!
- Create a 'face book' and let the newcomer introduce themselves on the intranet with a bit about themselves. For example, Tony Chocolonely has the 'Mugshot' and every new employee is photographed in a funny way. This photo will hang in the office, but will also be printed on a mug that the employee receives for the office.
- Take advantage of the ICEbreaker functionality in Microsoft Teams. With this, the new employee is linked to random colleagues to drink a cup of coffee online. Very nice if the onboarding process mainly takes place online.
- Also make the employee responsible for a good onboarding: give him or her personal assignments in the first week. For example: who has the best ping pong skills in the team? As a result, the employee has to participate in activities that belong to the culture, or schedule coffee moments with colleagues to find the answers.
Want to know more about the 4 C's that you can't forget during your onboarding? And tips to improve your process? Read the blog here!
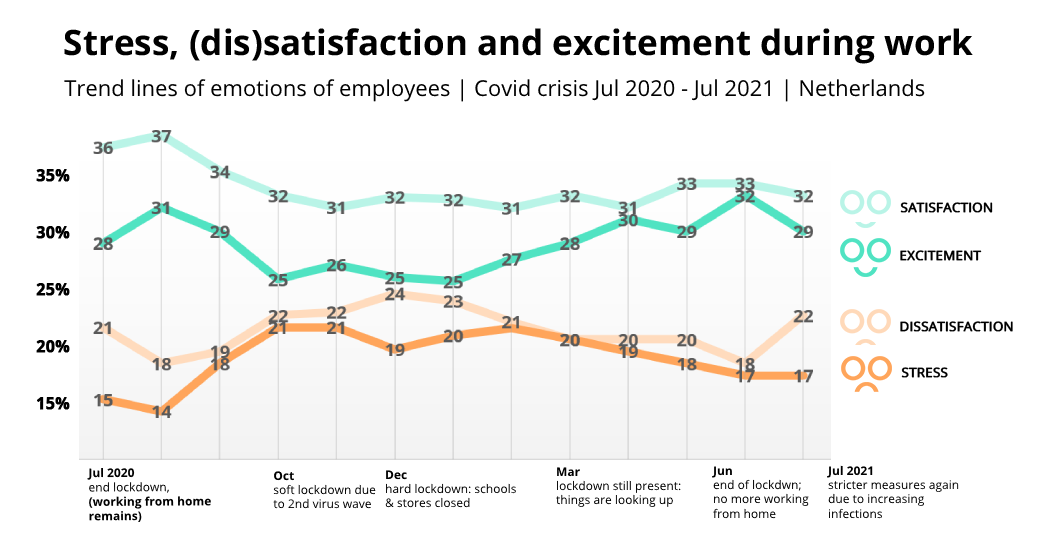
July is now over, and we are already halfway through the summer. And although we still had a positive view of the summer period in June, we soon received another blow in July. Covid-19 measures were tightened up again, infections rose, holidays were cancelled... That certainly does not have a positive effect on our moods!
And we see that reflected in the data. Because satisfaction dropped to 32%, and engagement even dropped to 29%. And because these two positive moods drop, that means a rise in negative emotions. For example, dissatisfaction rose by no less than 4% to 22%. The stress remained the same at 17%. In June we saw the best distribution of positive and negative emotions that we have had in 2021. But in July we are back at the same level as in April: with 61% positive emotions versus 39% negative emotions.
What does that mean for employees in the Netherlands? Again, even if some holidays are cancelled, it is important to really take that rest. We want to pick up the positive trend again as soon as possible, and prevent the moods from sinking further. It is therefore essential that employees can get back to work after the summer with fresh, renewed energy. Whether they work from home or in the office. You can read here how to do that.
Do you want to monitor the mood of your employees and organize the future of work as optimally as possible? Then take this free measurement with you for all the relevant insights!
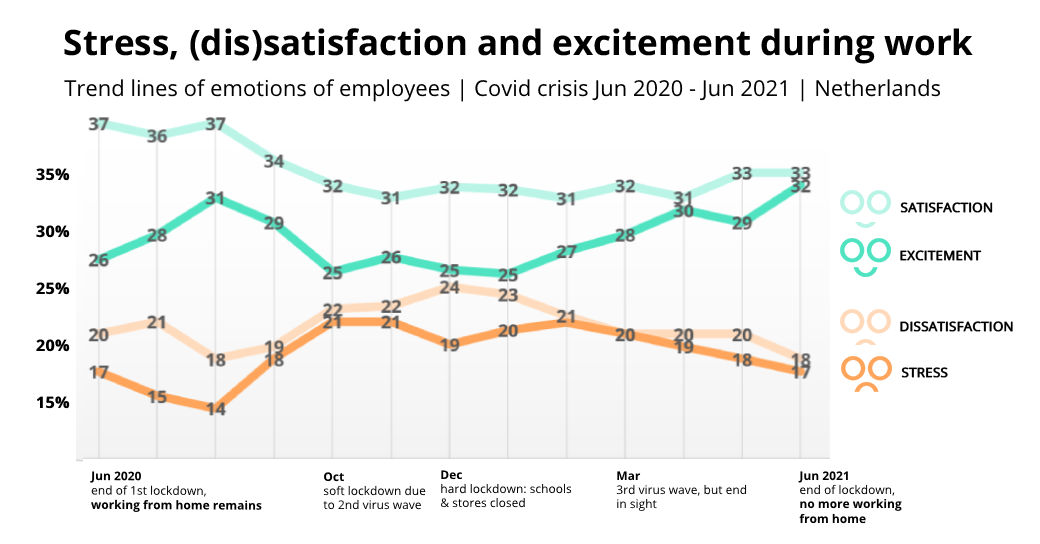
June has flown by again, and so all data of more than 20,000 working Dutch people are back in. In June we got more freedom, clubs and festivals opened again and we came closer and closer to 'normal'.
This is also reflected in the figures, which paint a convincingly positive picture. Because although satisfaction remained the same at 33%, engagement increased by no less than 3% to 32%. This also results in a downward trend for dissatisfaction to 18%, and stress dropped to 17%. This means that there is now a distribution of 65% positive emotions versus 35% negative emotions. That's the best distribution we've seen yet in 2021. Wow!
That is not the only remarkable thing: these figures are even slightly better than June 2019, before the Covid-19 crisis started. Just look at the chart below. Then there was a distribution of 62% positive emotions and 38% negative emotions. What can we get from that?
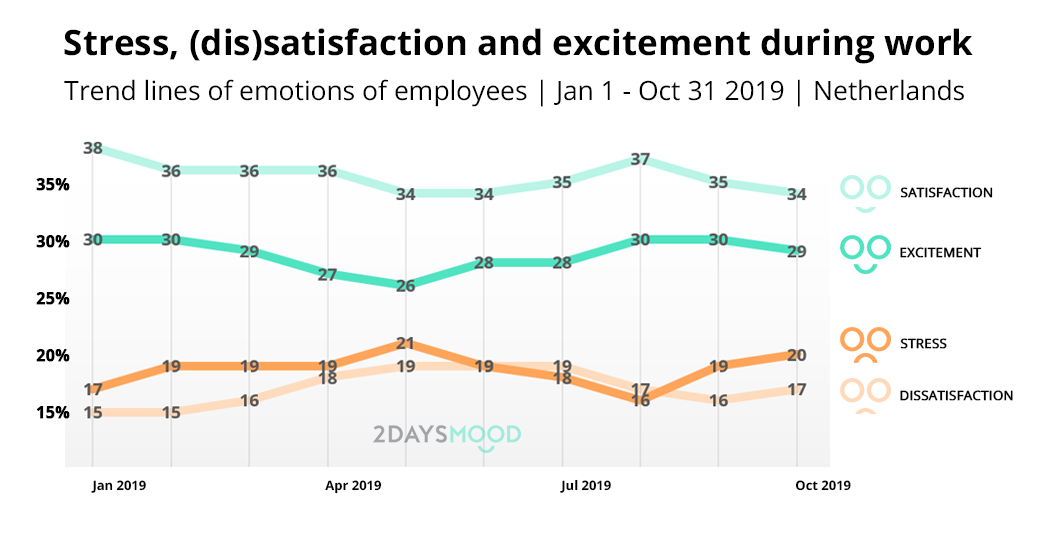
In June 2021, the stress and dissatisfaction are slightly lower than in June 2019, but the enthusiasm is especially interesting: it is 4% higher in 2021. Employees seem to have a renewed desire to get back to work. But we still have to look to the future with care - the infections are rising again, many countries are closing again and measures are getting stricter again.
If we look at the figures for 2019 and 2021, we see that stress and dissatisfaction are falling in both cases. This is because people generally use the summer months to recharge. But last year we saw a lot of fatigue after the summer. And that's not surprising: we couldn't really go on holiday abroad, which is why many employees worked through the summer without taking a holiday. Because people did not take time off to recharge, we saw a lot of fatigue and stress in the last months of 2020. So the tip for this summer: encourage your employees to absolutely take time off and unload. Rest is very important in these months, whether we go on holiday or not.
Do you want continuous insight into how your employees are doing with the constant change? Take the free measurement!
In the spotlight: fight boredom in the summer!
Are the summer months at work usually quiet for you? And are you afraid that you will get bored? Then you can prepare for that in advance. Because boredom at work can have many negative consequences, such as a bore-out. And of course you want to be ahead of that! With these tips you recognize, combat and prevent boredom at work.
How do you know whether you really suffer from structural boredom, or whether you are facing a bore-out? That is often difficult to determine. To spot it, look at these things:
Does your work vary enough?
Keep track of the tasks you've worked on every day for a week. Label the tasks by the type of work and how much you enjoyed it. This way you can quickly see in one overview whether your work has brought you satisfaction this week.
Do you work concentrated?
Are you often distracted? Do you keep switching tasks or are you browsing the internet? That can be a sign of boredom. Try to find out where your concentration leak is.
Do you work from your talents?
If you use your own talents, you are three times more likely to rate your quality of life as 'great'. So you should also use those talents in your daily work!
Do you want to know more & gain more tips on how to fight and prevent boredom? Read the blog here and stay engaged during the summer!
Some Covid-19 measures were relieved in May. For example, you could go to the gym again and the libraries opened up. This renewed freedom was a much needed breath of fresh air for many people!
The effects of the lessened measures are reflected in the happiness at work data of the workforce in the Netherlands. Satisfaction has risen to 33% and excitement has fallen to 29%. Dissatisfaction remains unchanged at 20% and stress drops further to 18%. This puts us at a distribution of 62% positive emotions versus 38% negative emotions. This continues the positive trend, and while we are still a long way from pre-Covid figures, we continue to go in the right direction.
Looking at more easing of Covid-measures in the future, we can expect that today's remote working will shift to a more hybrid form: working from home in combination with working at the office. This hybrid form of working brings new challenges with it. Because how do you ensure that people from a distance also feel and continue to feel part of the corporate culture? What will be the function of the office? And what do employees find important in this?
With the specific survey module “The future of work” you can easily and quickly collect feedback from employees about what they need when combining work from home and at the office. With this feedback you can get to work on organizing a strong and future-proof work culture at strategic and policy level.
Are you also working on what work culture will look like post-Covid? With this free measurement you are prepared for the future of work!
April has flown by already! Although the weather does not want to cooperate yet, we are getting closer to summer. The terraces and shops are now open again: the Netherlands was eagerly looking forward to this in April. We are again seeing a positive shift in the trend lines and emotions of employees. That is a good sign for the future!
We can see that although satisfaction has decreased by 1%, enthusiasm has increased by 2%. The 1% satisfied employees in March have not only retained their positivity, but also have a lot of energy despite the limitations surrounding the pandemic. With regard to negative emotions, dissatisfaction remains unchanged at 20%, and stress decreases by 1% to 19%. This brings us to a distribution of 61% positive emotions versus 39% negative emotions. Another step in the right direction, right?
Although hybrid work is getting closer with the continuously decreasing COVID-19 measures, about 25% of working Dutch people want to continue to work partly at home. Even if going to the office is allowed again. According to MT/Sprout (Dutch source), they can concentrate better here, and less travel time and the nature of the work are also important reasons for continuing to work from home in the future. But designing your hybrid working policy will become a matter of customization: employees with different life phases and home situations will all have a different view of this. Ultimately, hybrid work will develop into the standard. So make sure you are well prepared for this and read a number of tips below!
Are you ready for hybrid work? Take this free measurement for the right insights!
In the spotlight: tips for successful hybrid working
Are you already working on the hybrid working policy in your organization? If not, it is about time you get started. Because how can you now organize your organization as future-proof and sustainable as possible if we permanently (partly) work from home? And what should you pay attention to?
Our Employee Happiness Expert shared a number of tips for this. You can organize your hybrid work policy on the basis of five important themes.
A tip for each theme!
TIP 1: Make clear agreements with each other about working hours and breaks. Be alert to structural overtime with each other, and encourage each other to work as little as possible in the evenings and weekends and to really get some rest and relaxation.
TIP 2: Since you no longer see each other in the office every day, you will have to find new (creative) ways to do this. Ensure good internal communication, and vary in terms of communication styles that fit within your organization.
TIP 3: Also take the time for informal moments. Plan an informal pub quiz or online escape room or give a colleague a call to find out what their weekend was like. Find offline contact within the possibilities.
TIP 4: Be clear as a manager, but also empathetic. It is your job to communicate what you expect from your team members. A good way to check if everything is clear is to ask about it.
TIP 5: Make a plan for the office. Which tasks are difficult to perform at home and would employees like to do in the office? How can you set up your office for this? Perhaps there is a greater need for spaces where you can brainstorm together or work in teams. See how you can facilitate this as an organization.
More tips to make hybrid work a success? Take a look here!
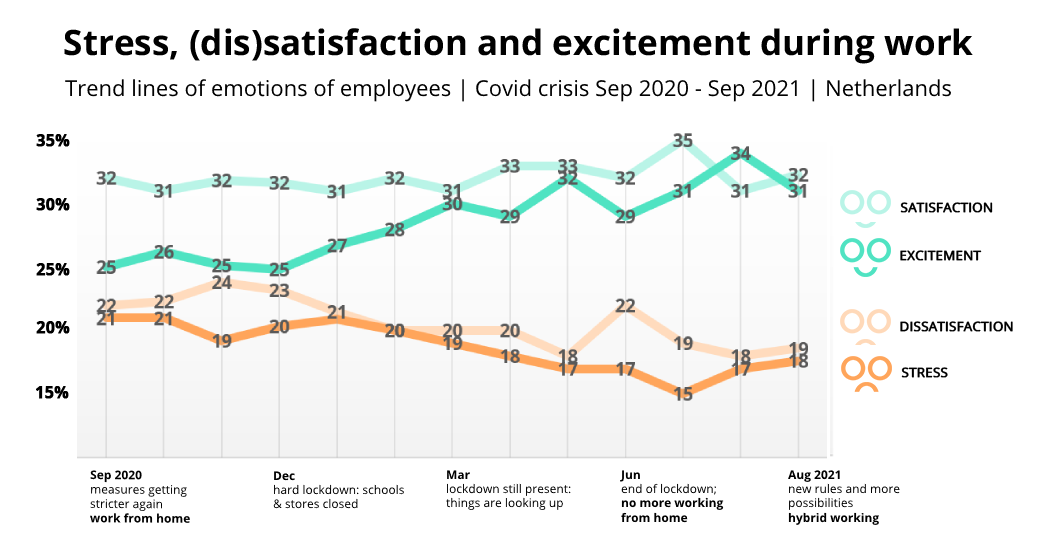
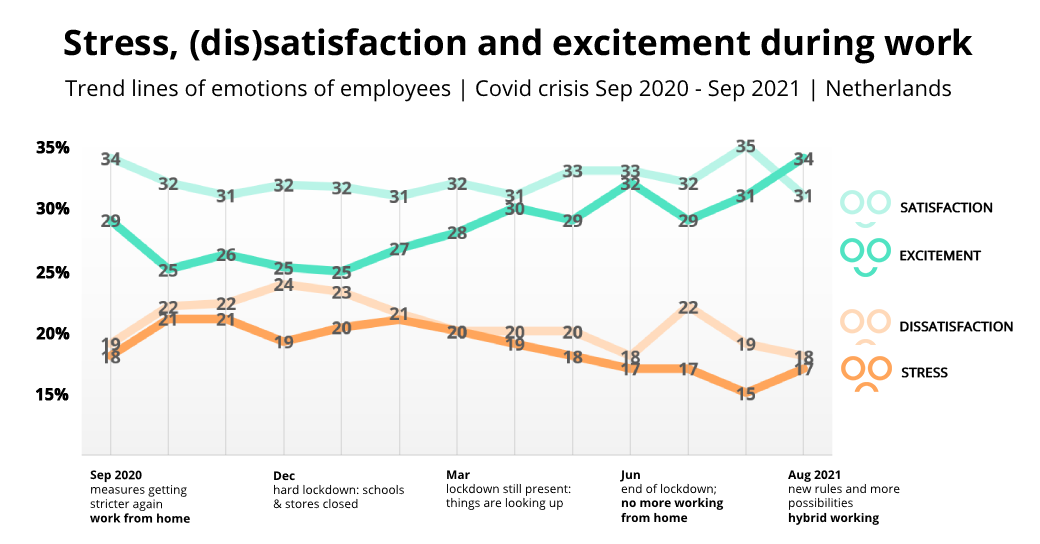
The spring month of March has arrived and that is a possible explanation for the latest happiness figures of the workforce in the Netherlands. We see a small positive signal. The pleasant moods during work, satisfaction and excitement have both increased by 1%, to 32% and 28% respectively. In addition, unpleasant moods, dissatisfaction and stress drop by 1%. They are now both at a level of 20%.
What does this mean? If we look at these numbers with hope, we can see the beginning of an upward trend. After all, there are some arguments for that. Spring has started with some beautiful sunny days, which could certainly make people happy! Also, although we are still in a lockdown while working from home, we are getting closer to the 'open-up' of the Netherlands. With careful steps and experiments, perspective is offered again and that gives us new energy.
Nevertheless, we still have to persevere, and that with an average of 40% negative emotions during work ... that could be better! A tip for this is: think ahead and make plans. Research (T. Amabile, S. Kramer, 2011) has shown that a sense of progress is one of the most important factors for a pleasant experience of your working days. And because the perspective is there, we can now realistically make ourselves busy with the possibility of meeting each other at the office again. What will that look like? What can we organize to restore connections? Are we sticking to the advantages of working from home and are we going to work hybrid?
Are you already making plans for hybrid working? Then use this free measurement for the right insights and internal support!
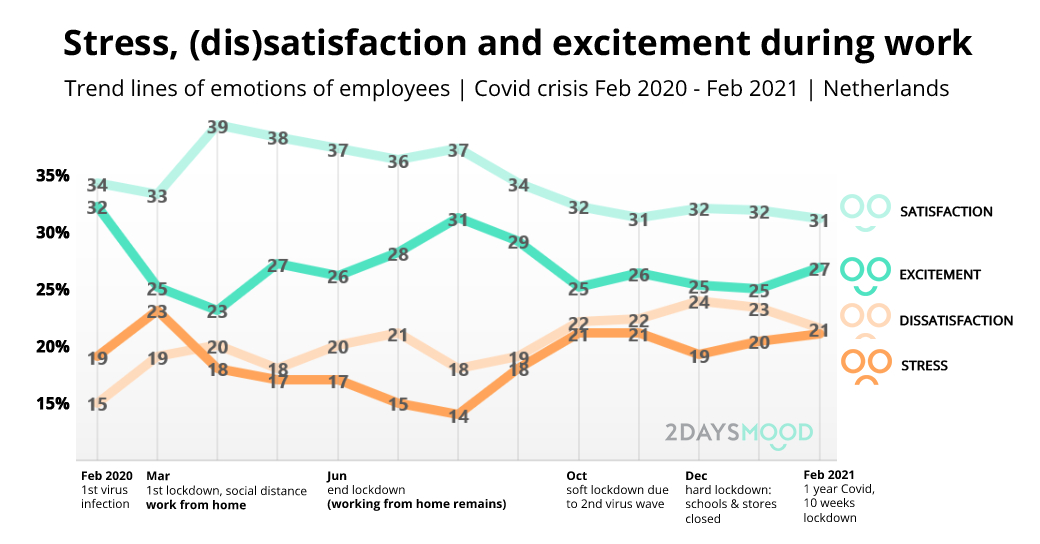
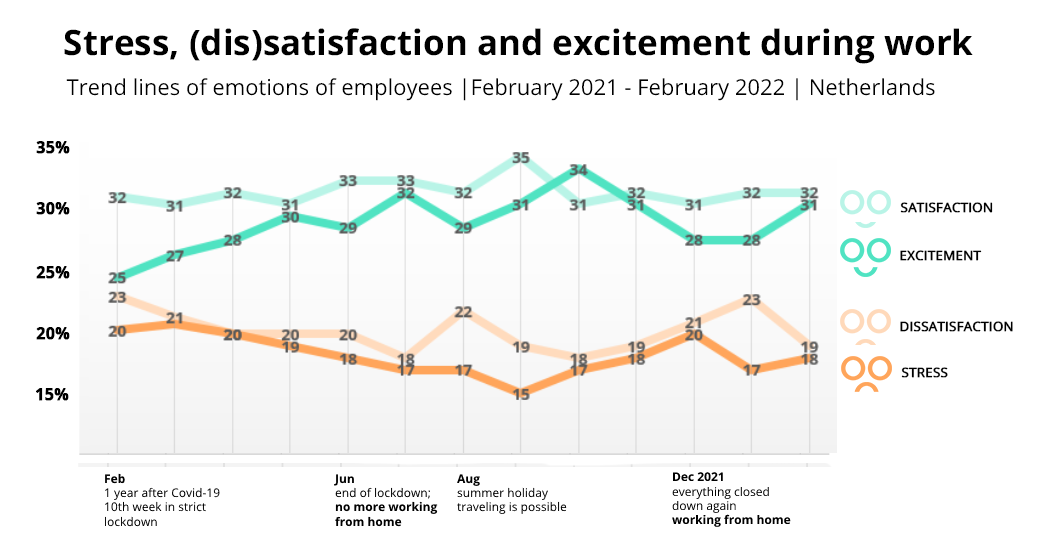
The February 2021 chart does not show significant changes in our moods at work. This is not surprising since the Netherlands has been in a lockdown for over 10 weeks and we have been working from home for almost a year due to the COVID-19 pandemic.
Better times are approaching, yet corona fatigue and uncertainty continues to prevail. On average, 21% of employees experience stress and dissatisfaction this month. This is 27% for enthusiasm and 31% for satisfaction.
It would be nice to convert the energy that is now going to negative emotions into positive emotions. Good news, you don't have to do it alone! It is smart to share experiences and tips with colleagues, other teams or even professionals from other organizations. We also did this in our HR Mastermind session last month.
5 Tips from HR masterminds
We are happy to share these original tips with you straight from the practice of the HR professional!
- Employee happiness as a core value: was it not yet a core value? Make sure you add employee happiness to the building blocks of your culture. This can help to make the subject negotiable at all levels of the organization. This is also a stimulating signal to employees to come up with initiatives themselves to increase their job satisfaction.
- Appoint change agents: make sure you involve enough ambassadors. Enthusiastic people who can help to bring more energy back into your organization or to give shape to the new normal. For example, post an internal vacancy for this.
- Talk roulette (or walk roulette): create more connection in your informal meeting. Do not turn it into a group discussion, but divide your colleagues into break-out rooms (via Zoom/Teams) so that you can really catch up 1-on-1. Switch a number of times so that you can speak to different colleagues. (A walking schedule is also a nice option!)
- Don't cut back on online getaways now: are there too few bright spots? Are all weeks ''the same''? Make sure you turn every holiday or milestone into something special at this time. Don't let the digital forms of communication hold you back, but 'own them'! From online escape room to pub quiz, with a few google searches you will find something that suits your company or team.
- From data to deeds: do you have access to a flexible survey tool such as 2DAYSMOOD's? Then make sure you give more feedback about the results, or set up a new survey that is now really relevant. Just like in this blog, you can share an internal ''enthusiasm monitor''. You show that there is continuous attention for the subject and you can set a goal: working together on an upward trend of enthusiasm!
In the spotlight: employer ambassadors (eNPS)
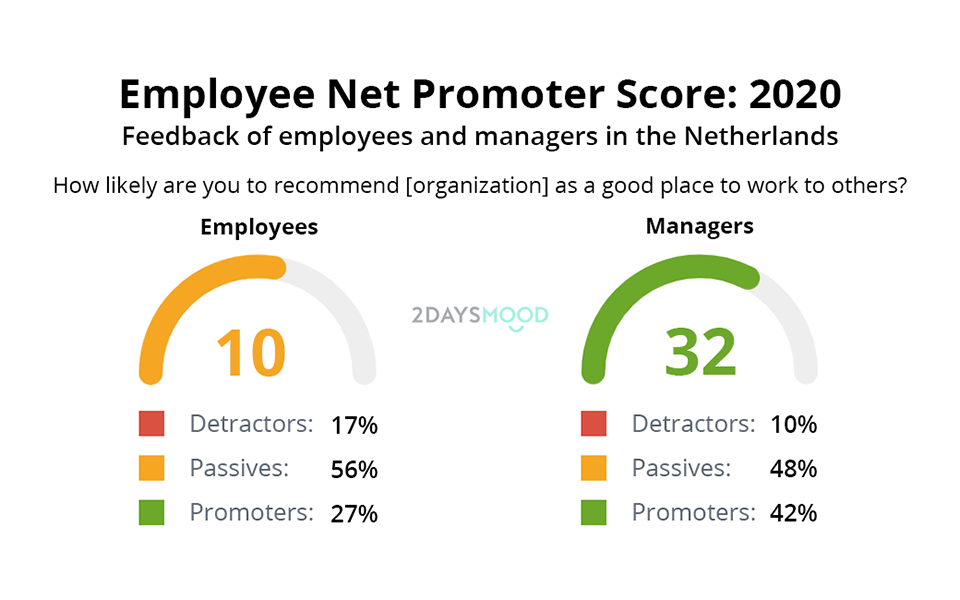
What is the eNPS?
The eNPS, employee Net Promotor Score, indicates to what extent employees are ambassadors for their organization. Would they recommend the company to others as a good employer? They answer that question on a scale of 1 to 10. Based on the results, 3 groups are created: Detractors, Passives and Promotors. An organization with a high eNPS (meaning many promotors and few detractors) often has a culture that leads to success, a high retention rate, and a strong position in the job market!
Read more information and 5 tips to take action on your eNPS here.
How do you use the eNPS as a benchmark?
Why are we now sharing this figure? If you have done an eNPS measurement in your organization yourself, you can benchmark these scores. The underlying formula is used internationally. Our graph above therefore shows that in the Netherlands in 2020 on average more people are promotors of their company than detractors. For employees this is a score +10 and for managers +32. That is good news! Because in 2019, the eNPS was -4 for employees and +26 for managers. (This data comes from about 15,000 surveys sent in organizations of different sizes and from various sectors.)
How can you use the eNPS in practice?
Of course it is valuable to have insight into these general figures. But we recommend that you attach even more value to your internal benchmark and the goals that you link it to. So, for example, start with a baseline measurement. And then decide for yourself what you think is a good employee Net Promotor Score for your company or team.
For example, set goals such as: We want to reduce the difference between employees and managers by x. We want to talk to all detractors to find out why they are dissatisfied! Or, for example, do not take the general eNPS as a measurement point, but look at the distribution of the scores. We want 80% of our organization to give an 8 or higher to the employer.
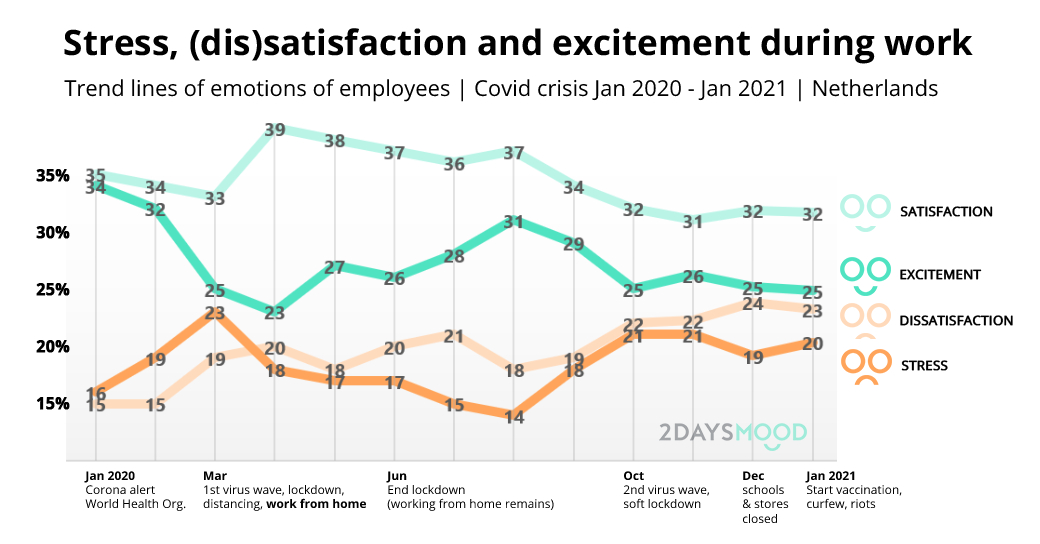
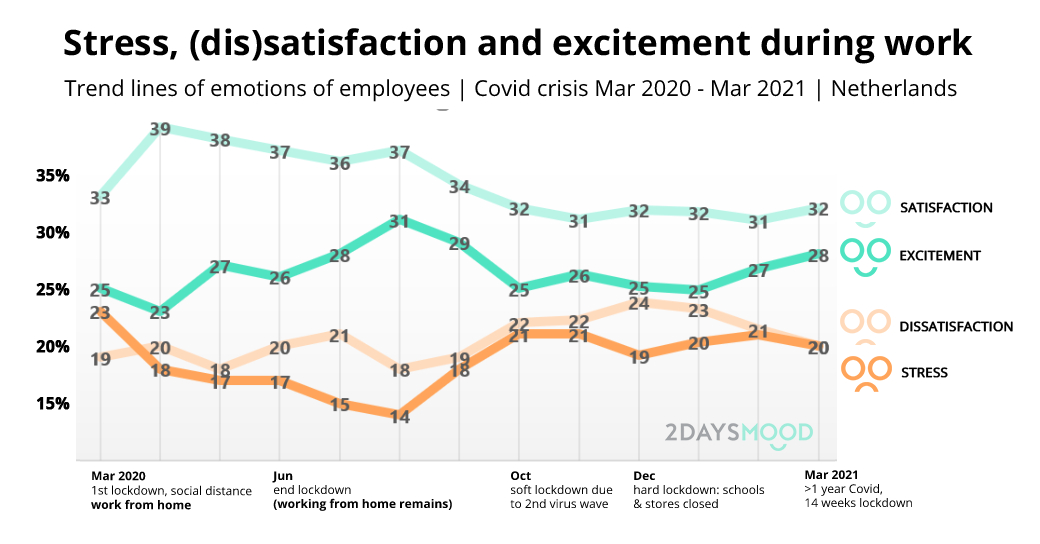
In January 2021, we see that employees feel as follows during work: 32% satisfied, 25% ecxited, 23% dissatisfied and 20% stressed. That is a score that makes organizations vulnerable. Compared to our benchmark guidelines and January 2020 (pre-corona), we experience 12% more negative emotions. In fact, we are almost on a 50/50 split of positive and negative moods. A working week shouldn't look like this, right?
What's more worrying is the fact that negative moods have been high for such a long time. Due to the Covid crisis (and working from home), 3 in 10 Dutch people experience feelings of loneliness, among young people that ratio has even increased to 5 in 10. (Source: Op1, 3 Feb 2021)
Professor of neuropsychology Erik Scherder discusses this in talk show Op1 and says: ''Loneliness is very much linked to stress, and chronic stress makes your brain more vulnerable. You produce a lot of cortisol, the stress hormone. Over time, this substance has a negative impact not only on your blood vessel system, but also on a number of brain areas that are related to, for example, memory, good planning skills and your reward mechanism."
For many remote workers the latter will be recognizable, the lack of that energy or kick that you usually get after successfully completing tasks or goals. This nice feeling of reward is drastically less when you experience stress or when you cannot share it with others (close to you).
How are we going to improve this now? We cannot change the context, so everyone in the organization has to get to work themselves. Do you best to find your energy sources and resilience!
TIP: Perhaps these 3 trainable soft skills can help.
Highlighted: vitality of employees and managers
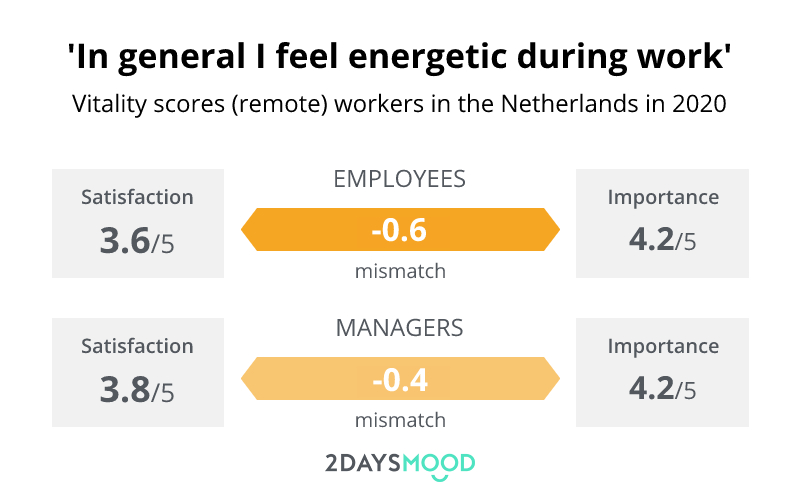
Since the Covid outbreak, we have seen that employees give their vitality an average of 3.6 on a scale of 5. In school grades a B+, which seems more than sufficient. It is striking though, that they score a 4.2 on the question "How important do you find an energetic feeling for your happiness at work?" In the desired situation, their vitality is an A+, not just sufficient, but (very) good. There is a mismatch, which means that improvement and more employee happiness can be achieved here. The data also shows a difference in vitality between managers and employees. It is good to be aware of this as a manager, how can you be an (even better) role model?
What is Vitality? Why is it important?
Vitality is a determining factor for employee engagement and happiness. Certainly in times of crisis and social distance, this factor weighs extra heavily. Vitality means that employees are able and willing to work under high work pressure or in stressful, insecure situations. It is an intrinsic source of energy that can be positively influenced by, among other things, a healthy lifestyle and work environment, meaning and support from social (work) relationships.
Vitality is one of the 15 drivers in the Employee Happiness Model®.
See you next month for more data and insights!
80%
less burnouts66%
less absenteeism59%
less turnover50%
more motivation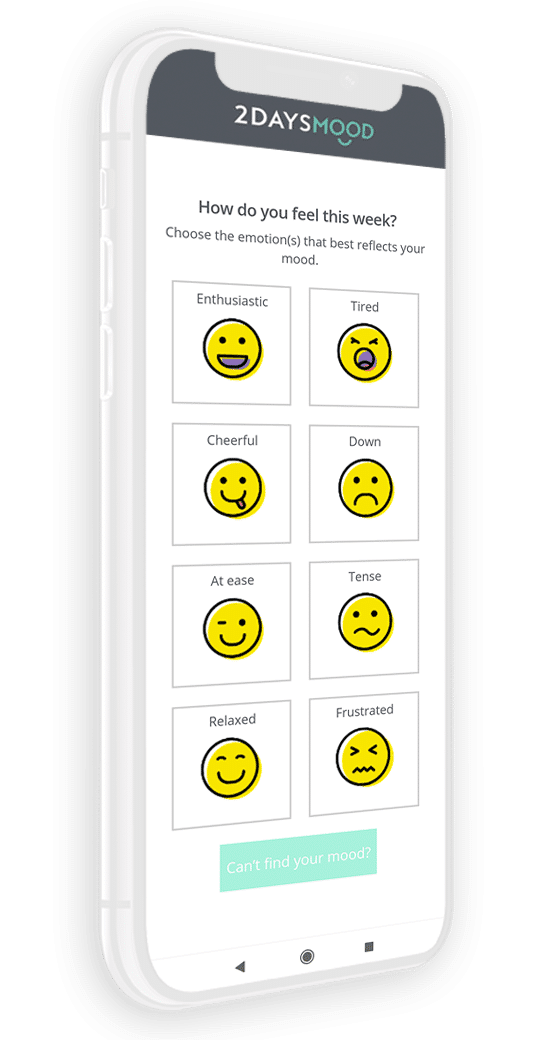
300%
more innovation180%
more energy45%
higher productivity37%
more sales successWhy 2DAYSMOOD
Engaged employees deliver the best effort and results
When employees feel engaged and happy, the positive effects are significant! From increasing productivity and energy to decreasing absenteeism and turnover. But how do you adjust your working climate to what teams need?
2DAYSMOOD researched, i.c.w. Utrecht University, which factors determine employee happiness and engagement. For example leadership, appreciation or work-life balance. They are part of our proven method ‘from data to deeds‘. Using simple surveys you gain more control over the mood in teams, and the risks and strengths of your culture!
Leverage the science
Profit from happiness

Get in touch for free advice, a demo or quick scan!
Always the employee survey that suits you.
Do you want to increase happiness in your teams? Collect feedback on a specific subject? Monitor stress in real-time? Or do you need a baseline survey to get insight in the drivers of your culture?
We are happy to help with your specific challenge, using:
- Our expertise, experience and energy!
- A demo of our tool (if you like)
- The opportunity to try it for free
- Or enjoy reading our brochure
